Scenes from the July jobs report [Note: I haven’t put up a Coronavirus dashboard in almost a week. I’ll try to get around to that later today or tomorrow. It isn’t *all* bad news.] Last Friday’s jobs report for July was probably the most uniformly positive report I have seen since I started writing about them going on 15 years ago. Let’s take a look at a few of the most salient items.First of all, unemployment (blue in the graph below) at 5.4% and underemployment (red) at 9.2% are about where they were in the middle of each of the last 3 expansions: Not a boom, but not bad at all either. This is real progress, and a real positive (note graph is normed at the 0 level equal to the current month in both numbers). On the other hand, when
Topics:
NewDealdemocrat considers the following as important: July jobs report, US EConomics
This could be interesting, too:
NewDealdemocrat writes JOLTS revisions from Yesterday’s Report
Bill Haskell writes The North American Automobile Industry Waits for Trump and the Gov. to Act
Bill Haskell writes Families Struggle Paying for Child Care While Working
Joel Eissenberg writes Time for Senate Dems to stand up against Trump/Musk
Scenes from the July jobs report
[Note: I haven’t put up a Coronavirus dashboard in almost a week. I’ll try to get around to that later today or tomorrow. It isn’t *all* bad news.]
Last Friday’s jobs report for July was probably the most uniformly positive report I have seen since I started writing about them going on 15 years ago. Let’s take a look at a few of the most salient items.
First of all, unemployment (blue in the graph below) at 5.4% and underemployment (red) at 9.2% are about where they were in the middle of each of the last 3 expansions:
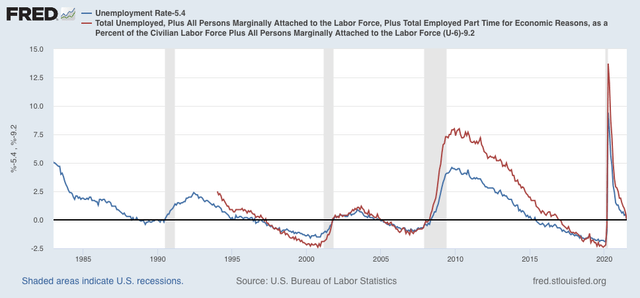
Not a boom, but not bad at all either. This is real progress, and a real positive (note graph is normed at the 0 level equal to the current month in both numbers).
On the other hand, when we look at those who aren’t actively looking, so aren’t counted in either the un- or under-employment rates, but say that they want a job now, we see that the number is close to the worst levels since the series started being reported in 1994:
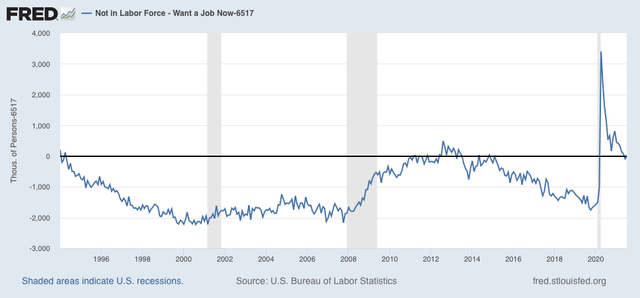
At 6.517 million, that’s about 1 million higher than the number at the midpoint of 2 of the last 3 expansions, and 1.5 million above the 3rd.
If we keep getting very good jobs reports, I expect this number to drop, but gradually, over the next 6 to 12 months.
Turning to the number of jobs added themselves, since the end of last year, we have added 4.318 million jobs:
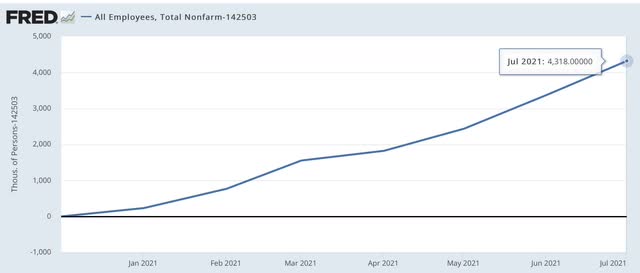
That’s an average of a little over 600,000 per month.
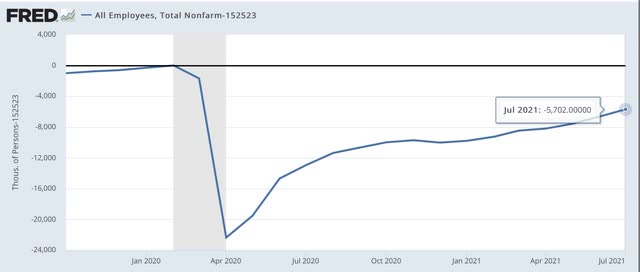
But we are still 5.7 million below where we were in February 2020. In other words, if the current – excellent! – rate of growth continues, it will still take 9 or 10 months to get back to the pre-pandemic levels.
Finally, here’s a look at the jobs deficit is several sectors:
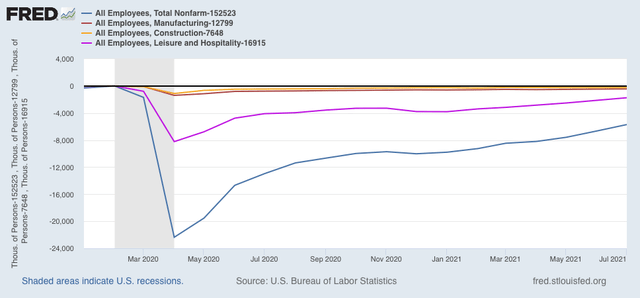
You can see that the total jobs deficit is mainly one in the service sector, especially leisure and hospitality.
Manufacturing and construction, relatively speaking, were never hit as hard, and are closer to making up their losses.
The jobs market was actually in quite good shape in the year before the pandemic, with lots of wage pressure due to nearly “full” employment, with lots of marginal and minority workers getting jobs. While it is by no means booming in the absolute sense now, we have made a lot of progress this year, but with a lot more distance still to go, especially in the services sector.