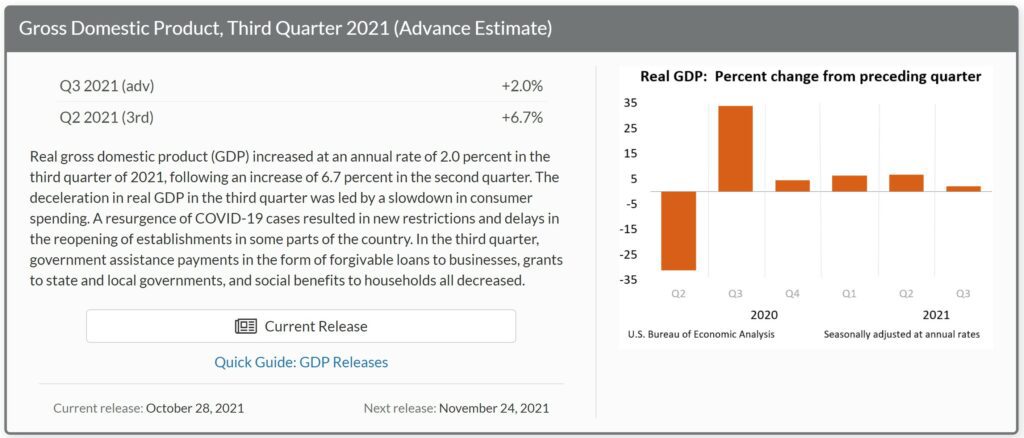
Commenter and Blogger, RJS MarketWatch 666 3rd quarter GDP, September’s income and outlays, durable goods, & new home sales The key economic reports that were released this week were the 1st estimate of 3rd quarter GDP and the September report on Personal Income and Spending, both from the Bureau of Economic Analysis ….the week also saw the release of the advance report on durable goods for September and the September report on new home sales, both from the Census bureau, and the widely watched Case-Shiller Home Price Index for August, an index generated by averaging relative home sales prices from June, July and August against a January 2000 baseline, and which reported that their national home price index for those 3 months averaged 19.8%
Topics:
run75441 considers the following as important: MarketWatch 666, RJS, US EConomics, US/Global Economics
This could be interesting, too:
NewDealdemocrat writes JOLTS revisions from Yesterday’s Report
Bill Haskell writes The North American Automobile Industry Waits for Trump and the Gov. to Act
Bill Haskell writes Families Struggle Paying for Child Care While Working
Joel Eissenberg writes Time for Senate Dems to stand up against Trump/Musk
Commenter and Blogger, RJS MarketWatch 666
3rd quarter GDP, September’s income and outlays, durable goods, & new home sales

The key economic reports that were released this week were the 1st estimate of 3rd quarter GDP and the September report on Personal Income and Spending, both from the Bureau of Economic Analysis ….the week also saw the release of the advance report on durable goods for September and the September report on new home sales, both from the Census bureau, and the widely watched Case-Shiller Home Price Index for August, an index generated by averaging relative home sales prices from June, July and August against a January 2000 baseline, and which reported that their national home price index for those 3 months averaged 19.8% higher than their price index generated by repeat home sales prices during the same 3 month period a year earlier…..
This week also saw the release of the Chicago Fed National Activity Index (CFNAI) for September, a weighted composite index of 85 different economic metrics, which fell to -0.13 in September from +0.05 in August, which was revised down from the +0.29 reported for August last month…that left the 3 month average of the CFNAI at +0.25 in September, down from +0.38 in August, which still indicates that national economic activity has been slightly above the historical trend over the summer months..
In addition, the week also saw the last three regional Fed manufacturing surveys for October: the Kansas City Fed manufacturing survey, covering western Missouri, Colorado, Kansas, Nebraska, Oklahoma, Wyoming and northern New Mexico, reported its broadest composite index rose to +31 in October, up from +22 in September and +29 in August, suggesting even more robust growth of that region’s manufacturing; the Richmond Fed Survey of Manufacturing Activity, covering an area that includes Virginia, Maryland, the Carolinas, the District of Columbia and West Virginia, reported its broadest composite index rose to +12 in October from -3 in September, suggesting a return to a moderate expansion of that region’s manufacturing, and the Dallas Fed Texas Manufacturing Outlook Survey, covering Texas and adjacent counties in Louisiana and New Mexico, reported its general business activity index rose from +4.6 in September to +14.6 in October, indicative of a return to moderate growth for the Texas economy, after a single month of sluggish growth …
