Coronavirus dashboard: As the winter wave takes hold, how much will resistance from prior infections hold numbers down? Europe and North America, the winter wave is underway. While vaccinations clearly work, in most countries of the West there is a reservoir of defiant anti-vaxxers, who are not going to get vaccinated unless they are absolutely forced to. What does that mean for the present, immediate, and longer term future of endemic COVID? In the US, nationwide average cases have increased from just over 70,000 3 1/2 weeks ago to nearly 95,000 yesterday, but about 5,000 of that is probably because Veterans Day went out of the weekly average. Deaths increased slightly from their roughly 1150 plateau as well: In the graph above, it is
Topics:
NewDealdemocrat considers the following as important: Healthcare, winter wave coronavirus epidemic
This could be interesting, too:
Bill Haskell writes Families Struggle Paying for Child Care While Working
Joel Eissenberg writes RFK Jr. blames the victims
Joel Eissenberg writes The branding of Medicaid
Bill Haskell writes Why Healthcare Costs So Much . . .
Coronavirus dashboard: As the winter wave takes hold, how much will resistance from prior infections hold numbers down?
Europe and North America, the winter wave is underway. While vaccinations clearly work, in most countries of the West there is a reservoir of defiant anti-vaxxers, who are not going to get vaccinated unless they are absolutely forced to. What does that mean for the present, immediate, and longer term future of endemic COVID?
In the US, nationwide average cases have increased from just over 70,000 3 1/2 weeks ago to nearly 95,000 yesterday, but about 5,000 of that is probably because Veterans Day went out of the weekly average. Deaths increased slightly from their roughly 1150 plateau as well:
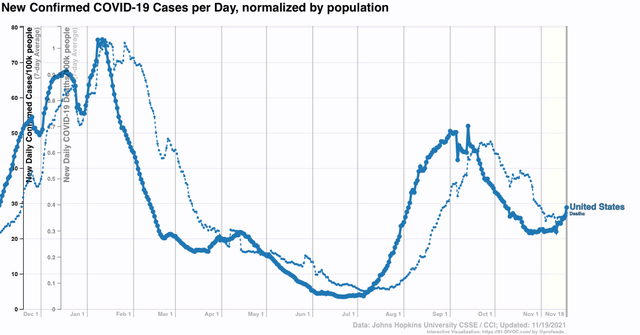
In the graph above, it is interesting to contrast the current situation with that of one year ago cases. With similar weather, but no vaccinations, and several subsequent huge waves of infections, in the first 2 weeks of November US cases had more than doubled to roughly 170,000. How much of that is vaccinations, and how much if any is increased seroprevalence among the population due to having already been infected?
Domestically among US States, one year ago there was the worst outbreak of the entire disease that was centered on the Dakotas, and started with the Sturgis motorcycle rally in early August. South Dakota went from 9 cases/100,000 to 165 per 100,000 at the peak in mid-November. This year it went from 4 cases/100,000 just before the rally to a peak of 64 per 100,000 5 weeks later, and has since declined to as low as about 35 per 100,000. As of today with very noisy data it is between 45 to 50/100,000.
Even now only 54% of South Dakotans are fully vaccinated. In North Dakota, only 48% are. By contrast, a similarly populated rural State, Vermont, is 72% fully vaccinated.
So let’s compare both North and South Dakota with Vermont. First, here are average weekly cases for all three States since the start of the pandemic:
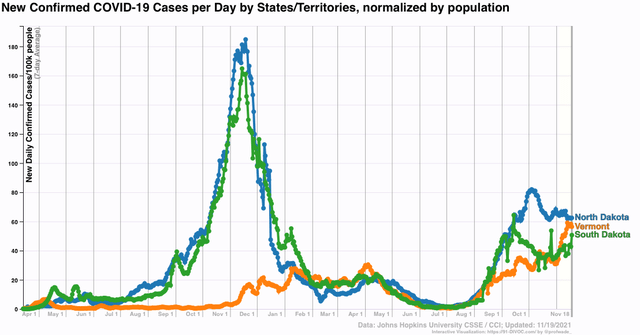
Vermont had been a star, up until the last 45 days, with the lowest % of infections of all States throughout 2020. More particularly, since their massive outbreaks one year ago, it is particularly noteworthy that the Dakotas and Vermont tracked virtually identically up until the Sturgis rally this August, despite their radically different vaccination levels.
Here is the cumulative number of confirmed cases in all 3 States:
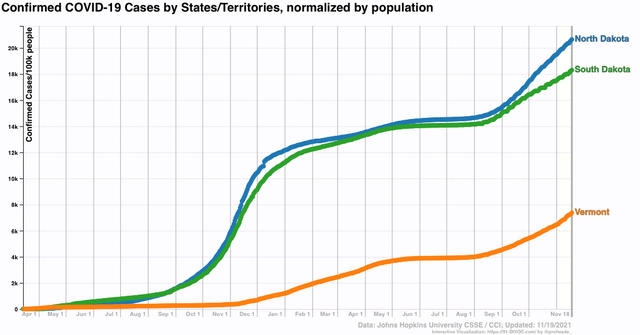
Since February 1 of this year, 5.5% of Vermonters have had confirmed infections. Only slightly more, 6.1%, of South Dakotans have, while in North Dakota the numbers are worse, at 7.9% of the population newly infected since then.
In short, it certainly does seem, at least in the case of South Dakota, and maybe in North Dakota as well, that the massive outbreak last autumn has acted to depress cases ever since – although Delta still made a substantial impact.
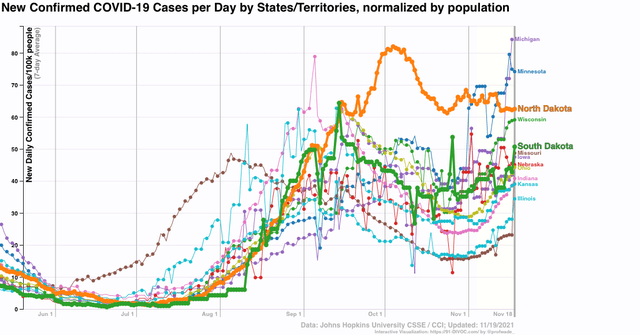
This also seems to be borne out by the MIdwestern numbers as a whole, as States immediately adjacent to the Dakotas are seeing much bigger increases – among the biggest of all States, while the Dakotas by contrast are like the calm in the eye of a hurricane:
Next, let’s look at the US States in the lower Mississippi Valley and Deep South, where Delta first struck:
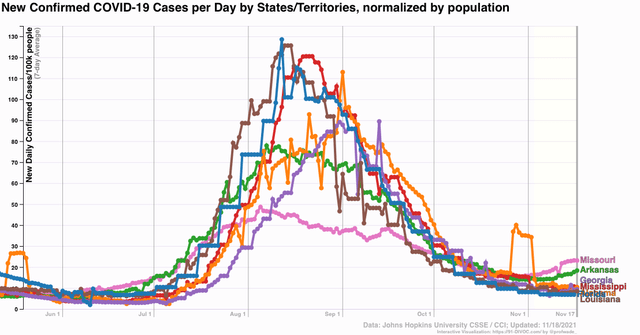
MO and AR have increasing trends, while FL, LA, MS, and AL look flat except for the Veterans Day comparison. Florida, with fewer than 7 new cases per 100,000, now has the lowest rate of all 50 US States (although Puerto Rico, with 4 cases per 100,000, is doing even better). I emphasize that this is not to praise Florida in the slightest, as it has among the highest total infection and death rates among the entire country, but rather to point out that, Delta having burned through the dry tinder, and with weather now more favorable to outdoor activities, there are fewer susceptible people left.
In short, when we look domestically within the US, it certainly does appear that prior outbreaks, particularly more recent outbreaks of Delta, have provided substantial resistance to the spread of new infections.
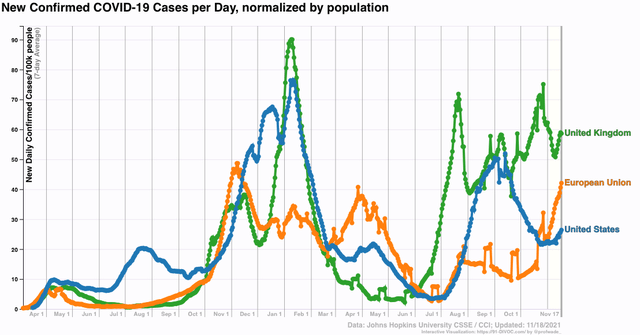
Some interesting international numbers tell a similar tale. The UK, after a quick 2-week decline of 40% from Delta’s original peak, has had numbers see-sawing generally between that peak and trough for the past 3 months and is currently averaging 60 cases/100,000. With a few exceptions the EU, by contrast, largely escaped Delta’s summer wave, but in the past 7 weeks has seen it really take hold, jumping from 10 to 45 cases/100,000. *If* present trends continue, the EU could overtake the UK in 10 to 14 days:
On the other hand, Canada, immediately adjacent to some of the currently worst hit US States, has only had a slight increase from 6 to 7 cases/100,000 in the past 2 weeks. This is particularly noteworthy since 76% of Canadians are fully vaccinated, only a little above New England’s 70%+, and less than 10% higher than Germany, currently having a huge outbreak. Also, needless to say Canada’s weather is not particularly balmy compared with the northern tier of US States.
Here is what Canada’s numbers look like compared with the adjacent Northeastern US, which has similar if slightly lower vaccination numbers:
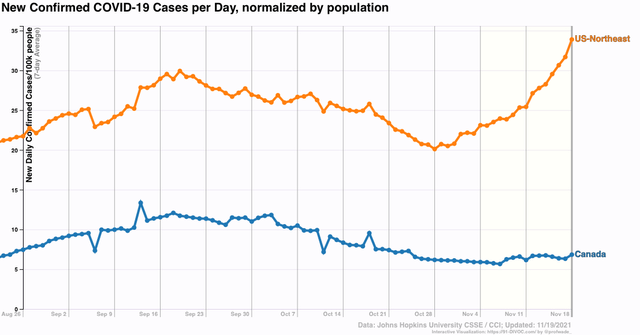
I suspect there are two explanations for this. One presumably is more universal compliance with public health measures in Canada. I suspect the other has to do with there being significant pockets of anti-vaxx resistance even in the heavily vaccinated States of New England. In other words, once you cross a certain threshhold – say, 70% – of vaccinations, maybe there is little additional benefit in terms of limited spread, while substantial pockets of 50% or 60% vaccinations still allow major outbreaks, with some leakage into the more heavily vaccinated regions.
I continue to think that this year’s winter wave will be substantially lower than last year’s – although it may exceed this summer’s Delta wave – and that each wave thereafter will echo, at increasingly lower levels, similar waves from one year previous, as both vaccinations increase, and resistance from prior infection among the unvaccinated population increases as well.
