RJS, MarketWatch 666 ~~~~~~~ Summary: Retail Sales Fell 0.3% in May After March and April Sales Were Revised Lower Seasonally adjusted retail sales fell 0.3% in May after retail sales for April were revised 0.4% lower. The Advance Retail Sales Report for May (pdf) from the Census Bureau estimated our seasonally adjusted retail and food services sales totaled 2.9 billion for the month, which was a decrease of 0.3 percent (±0.5%) from April’s revised sales of 4.7 billion. This was 8.1 percent (±0.7 percent) above the adjusted sales of May of last year . . . April’s seasonally adjusted sales were revised from the record high 7.7 billion reported last month to 4.7 billion, while March sales were revised from 1.6 billion to
Topics:
Angry Bear considers the following as important: MarketWatch 666, Retail and Food Sales, RJS, US EConomics
This could be interesting, too:
NewDealdemocrat writes JOLTS revisions from Yesterday’s Report
Bill Haskell writes The North American Automobile Industry Waits for Trump and the Gov. to Act
Bill Haskell writes Families Struggle Paying for Child Care While Working
Joel Eissenberg writes Time for Senate Dems to stand up against Trump/Musk
RJS, MarketWatch 666
~~~~~~~
Summary: Retail Sales Fell 0.3% in May After March and April Sales Were Revised Lower
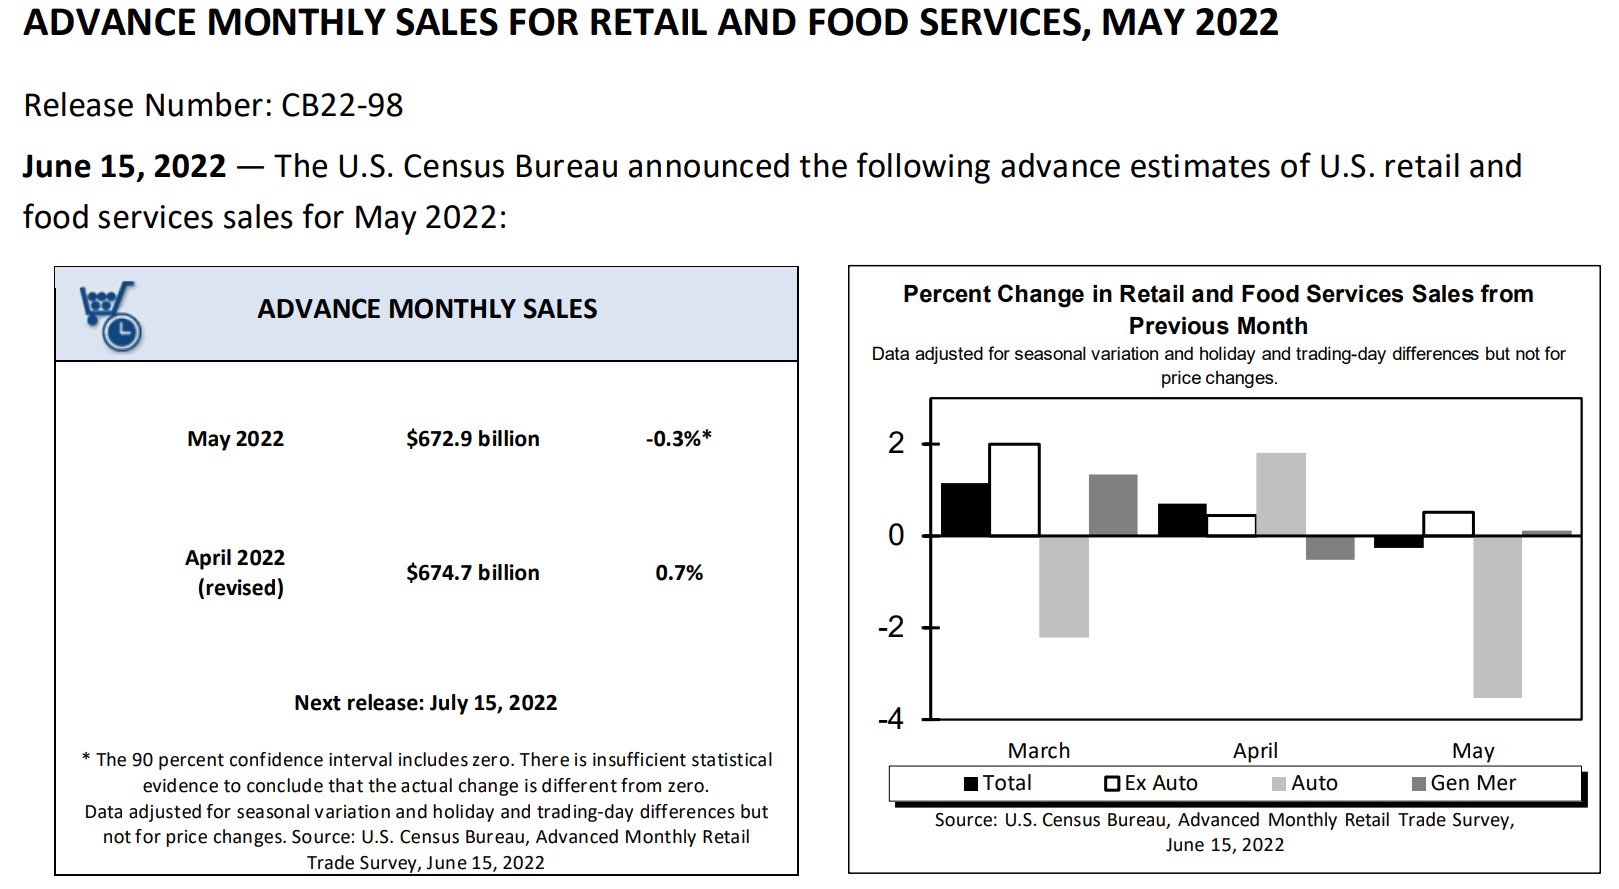
Seasonally adjusted retail sales fell 0.3% in May after retail sales for April were revised 0.4% lower. The Advance Retail Sales Report for May (pdf) from the Census Bureau estimated our seasonally adjusted retail and food services sales totaled $672.9 billion for the month, which was a decrease of 0.3 percent (±0.5%) from April’s revised sales of $674.7 billion. This was 8.1 percent (±0.7 percent) above the adjusted sales of May of last year . . . April’s seasonally adjusted sales were revised from the record high $677.7 billion reported last month to $674.7 billion, while March sales were revised from $671.6 billion to $669,958 million, which meant that March to April percent change was revised from an increase of 0.9 percent (± 0.5 percent) to an increase of 0.7 percent (± 0.2 percent)…the $1.64 billion downward revision to March sales should reduce nominal first quarter PCE at around a $6.6 billion annual rate and subtract about 0.11 percentage points, give or take, from 1st quarter GDP when the 3rd estimate is released at the end of the month….estimated sales before seasonal adjustments, which were extrapolated from surveys of a small sampling of retailers, indicated sales actually rose 2.4% before the adjustment, from $681,635 million in April to $697,715 million in May, while they were up 8.2% from the $644,652 million in actual sales of May a year ago…
Included below is the table of the monthly and yearly percentage changes in sales by business type taken from the Census pdf. The first double column below gives us the seasonally adjusted percentage change in sales for each type of retail business from April to May in the first sub-column, and then the year over year percentage change for those businesses since last May in the 2nd column. The second pair of columns gives us the revision of last month’s April advance monthly estimates (now called “preliminary”) as revised with this report. Likewise for each business type, with the March to April change under “Mar 2022 r” (revised) and the revised April 2021 to April 2022 percentage change in the last column shown…for your reference, our copy of the table of last month’s advance April estimates, before this month’s revision, is here:

To compute May’s real personal consumption of goods data for national accounts from this May retail sales report, the BEA will use the corresponding price changes from the May consumer price index, which we reviewed last week. To estimate what they will find, we’ll first separate out the volatile sales of gasoline from the other totals, From the third line on the above table, we can see that May retail sales excluding the 4.0% increase in sales at gas stations were down by 0.7%, Then, by subtracting the actual dollar amounts representing the 1.2% increase in grocery & beverage sales and the 0.7% increase in food services sales from that total, we find that core retail sales were down by 1.3% for the month. Since the May CPI report showed that the composite price index of all goods less food and energy goods was 0.7% higher in May, we can thus figure that the change in real retail sales excluding food and energy sales will amount to a decrease of nearly 2.0%. However, the actual adjustment in national accounts for each of the types of sales shown above will vary by the change in the related price index. For instance, while nominal sales at motor vehicle & parts dealers were down 3.5% in May, the May price index for transportation commodities other than fuel was 1.4% higher, which would suggest that real unit sales at auto & parts dealers were probably on the order of 4.8% lower once price increases are taken into account. Similarly, while nominal sales at clothing stores were 0.1% higher in May, the apparel price index was 0.7% higher, which suggests that real sales of clothing actually fell around 0.6%…
In addition to figuring those core retail sales, to make an estimate of the month’s change in real sales, we’ll need to adjust food and energy retail sales for their price changes separately, just as the BEA will do. The May CPI report showed that the food price index was 1.2% higher, as the price index for food purchased for use at home rose 1.4% while the index for food bought away from home was 0.1% higher. Thus, while nominal sales at food and beverage stores were 1.2% higher, real sales of food and beverages would have been around 0.2% lower in light of the 1.4% higher prices. Meanwhile, the 0.7% increase in nominal sales at bars and restaurants, once adjusted for 0.7% higher prices, suggests that real sales at bars and restaurants were roughly unchanged during the month. On the other hand, while sales at gas stations were up 4.0%, there was also a 4.1% increase in the price of gasoline during the month, which would suggest that real sales of gasoline were up on the order of 0.1% lower, with a caveat that gasoline stations do sell more than gasoline, products which should not be adjusted with gasoline prices. Reweighing and averaging the real sales changes that we have thus estimated back together, and excluding food services, we can then estimate that the income and outlays report for May will show that real personal consumption of goods fell by nearly 1.6% in May% in May. After rising by a revised 0.7% in April and being virtually unchanged in March, but after falling by 1.0% in February and rising by 3.6% in January. At the same time, since real sales at bars and restaurants were unchanged, they will add nothing to the growth rate of May’s real personal consumption of services….