Coronavirus dashboard for June 6: transitioning ever so gradually into a less fatal endemic condition The economic calendar is very light this week, with no significant news until Thursday, so let’s take this opportunity to update the situation with COVID-19. First, as of one week ago subvariant BA.2.12.1 continues to increase very slowly its share of overall cases, up to 59% nationwide: (Dan here…graphs can be enlarged at Bonddad blog…click the title) This subvariant makes up 78% of cases in NY and NJ, but only 38% in the Northwest. Meanwhile new subvariants BA.4/5 (still listed as BA.1.1.529 by the CDC) has risen to 6.1% of all cases, with a high of 12.4% in the northern Great Plains, and a low of 2.9% in NY and NJ: The BA.2.12.1 wave
Topics:
NewDealdemocrat considers the following as important: Healthcare, June coronavirus dashboard
This could be interesting, too:
Bill Haskell writes Families Struggle Paying for Child Care While Working
Joel Eissenberg writes RFK Jr. blames the victims
Joel Eissenberg writes The branding of Medicaid
Bill Haskell writes Why Healthcare Costs So Much . . .
Coronavirus dashboard for June 6: transitioning ever so gradually into a less fatal endemic condition
The economic calendar is very light this week, with no significant news until Thursday, so let’s take this opportunity to update the situation with COVID-19.
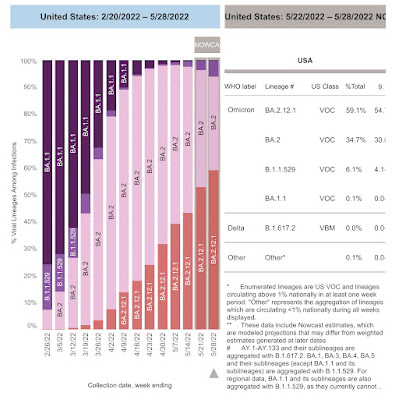
First, as of one week ago subvariant BA.2.12.1 continues to increase very slowly its share of overall cases, up to 59% nationwide: (Dan here…graphs can be enlarged at Bonddad blog…click the title)

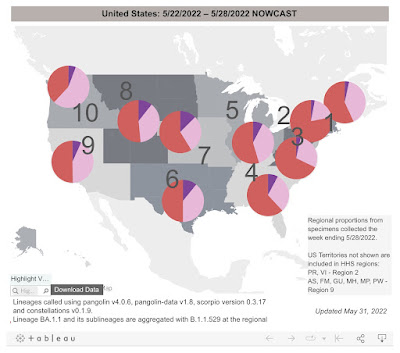
This subvariant makes up 78% of cases in NY and NJ, but only 38% in the Northwest. Meanwhile new subvariants BA.4/5 (still listed as BA.1.1.529 by the CDC) has risen to 6.1% of all cases, with a high of 12.4% in the northern Great Plains, and a low of 2.9% in NY and NJ:

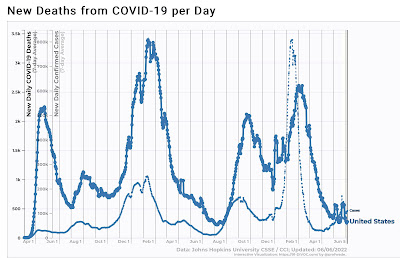
The BA.2.12.1 wave appears to have peaked 8 days ago, at 115,700 cases. It is presently down to 106,800. Meanwhile, deaths have *still* continued to decline from their Omicron peak of February, making a new 10 month low of 258 on June 3rd:

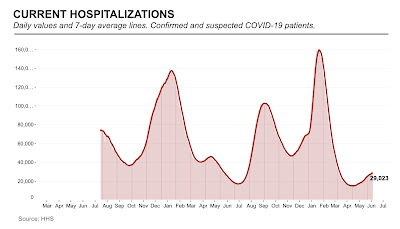
Hospitalizations have continued to increase, up to just over 29,000, compared to their low of 10,264 on April 6:

The trend of COVID not being nearly as lethal as it was originally (regardless of the causation) continues. Two really important trends stand out.
The first is that we are now more than 2 full months after the post-Omicron trough, and yet deaths have continued to ever so slowly decline, as noted above making a new low just a few days ago. Typically, as is shown in the chart below, hospitalizations have made peaks and troughs simultaneously with or just slightly after cases, while deaths make equivalent peaks or troughs within 3-4 weeks later:
| Event Peak | CasesDate | HospsDate | DeathsDate | |
|---|---|---|---|---|
| Alpha | 1/11/21 | 1/9/21 | 1/13/21 | |
| Delta | 9/5/21 | 8/27/21 | 9/21/21 | |
| Omicron | 1/15/22 | 1/15/22 | 2/1/22 | |
| BA.2.12.1 | 6/3/22* | N/a | N/a | |
| EventTrough | ||||
| Alpha | 6/21/21 | 6/25/21 | 7/8/21 | |
| Delta | 10/26/21 | 11/5/21 | 11/27/21 | |
| Omicron | 4/4/22 | 4/6/22 | 6/3/22* | |
| BA.2.12.1 | N/a | N/a | N/a | |
| — | ||||
| — | ||||
So the fact that deaths are *still* declining more than 2 months after cases started to rise again speaks of a big change having happened.
Secondly, when we look comparatively at hospitalizations and deaths vs. confirmed cases, we see that with each successive wave, there are fewer hospitalizations vs. confirmed cases and even fewer deaths.
The below chart norms the “Alpha” wave of winter 2020-21 to 1.00 for all metrics and then compares successive peaks and troughs of subsequent waves with that respective peak and trough.
Note that, with one exception (hospitalizations due to Delta at peak), hospitalizations rose less and fell more than cases did during each successive wave after Alpha. Deaths have declined comparatively even more:
| Event Peak | Cases#(Thous.) | Hosps.#(Thous.) | Deaths#(Number) | |
|---|---|---|---|---|
| Alpha | 1.00 (251.8) | 1.00 (117.7) | 1.00 (3,393) | |
| Delta | 0.66 (166.2) | 0.74 (87.4) | 0.62 (2,117) | |
| Omicron | 3.21 (807.8) | 1.31 (154.0) | 0.77 (2,609) | |
| BA.2.12.1 | 0.46* (115.7) | 0.25* (29.0) | N/a | |
| EventTrough | ||||
| Alpha | 1.00 (11.5) | 1.00 (13.1) | 1.00 (223) | |
| Delta | 6.17 (70.9) | 2.71 (35.5) | 3.68 (821) | |
| Omicron | 2.32 (26.7) | 0.77 (10.3) | 1.16* (258) | |
| BA.2.12.1 | N/a | N/a | N/a | |
| — | ||||
| — | ||||
At the peak of Omicron in January, more than 3x as many people had confirmed cases as compared with Alpha, but there were only 1.3x as many hospitalizations and less than 0.8x as many deaths.
As of the most recent post-Omicron trough, cases were still nearly 3x as high as the post-Alpha trough, but hospitalizations made a new all-time low of .77x compared with the post-Alpha trough, and deaths – still declining as of a few days ago – are less than 1.2x as many as the post-Alpha trough.
Probably the recent relative decline in hospitalizations is due more than anything else to Paxlovid, which when taken promptly after the onset of symptoms, has been very effective.
When it comes to deaths, the causation may be one or more of many things: an inherent weakening of the successive variants, resistance due to the prevalence of vaccinations and/or previous infections in the population, more effective treatments in the hospital, or simply that the most vulnerable population already died of the disease, so there are many few extremely susceptible individuals left – or something else, or any combination of the above.
But, whatever the reason, COVID now has the approximate fatality rate as a typical bad flu season. I expect new variants and new waves of COVID to continue but appears more and more likely that it is ever so gradually transforming into an endemic condition.
