By David Zetland (originally published at The one-handed economist) I’m not shy about criticizing the weakest elements of economics (there are many), so it’s sometimes a good idea to remind myself (and you!) of the strengths of economics, i.e., those characteristics that make it useful. Here’s an example based on a test-question I just asked: You are a baker facing higher energy (natural gas) prices. Higher prices result from (choose one for each): (i) A change in demand or quantity demanded? (ii) A change in supply or quantity supplied? (iii) Which impact came first? The start of the right answer lies in the question (“higher natural gas prices”), which result from Russia’s (recent) invasion of Ukraine, i.e., impacts from closing and
Topics:
Dan Crawford considers the following as important: David Zetland, US EConomics, US/Global Economics
This could be interesting, too:
NewDealdemocrat writes JOLTS revisions from Yesterday’s Report
Bill Haskell writes The North American Automobile Industry Waits for Trump and the Gov. to Act
Bill Haskell writes Families Struggle Paying for Child Care While Working
Joel Eissenberg writes Time for Senate Dems to stand up against Trump/Musk
by David Zetland (originally published at The one-handed economist)
I’m not shy about criticizing the weakest elements of economics (there are many), so it’s sometimes a good idea to remind myself (and you!) of the strengths of economics, i.e., those characteristics that make it useful.
Here’s an example based on a test-question I just asked:
You are a baker facing higher energy (natural gas) prices. Higher prices result from (choose one for each): (i) A change in demand or quantity demanded? (ii) A change in supply or quantity supplied? (iii) Which impact came first?
The start of the right answer lies in the question (“higher natural gas prices”), which result from Russia’s (recent) invasion of Ukraine, i.e., impacts from closing and damaged pipelines, embargos, etc.). So the answer to (iii) is that the supply shock came first.
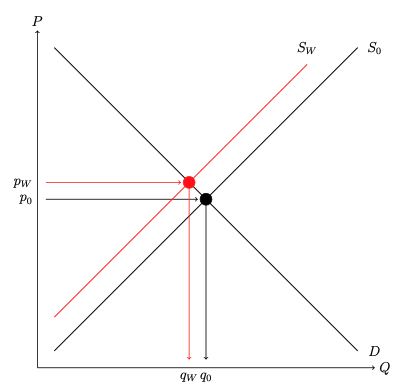
Now what about quantity supplied vs supply of natural gas? The first refers (in economic jargon) to changes in price or quantity within a supply/demand figure “holding all else equal.” Since the figure only shows the price/quantity relationship, other changes do not move up/down the line; they shift the line entirely. What’s assumed is that the line represents “supply in the market” (a mix of technologies, firms, geographies) and how, typically, you can get more quantity by offering a higher price (thus, the rise from left to right). In the case of the war, a few things (firms, geographies) are NOT being held constant. Indeed, the supply curve shifted in due to a loss of some/all Russian NG supply. That’s called a “change in supply” from S0 (baseline, in black) to SW (war, in red)
What about demand? Its components (income, tastes, substitutes) were still “equal” when supply shifted in, so it doesn’t shift. Instead, prices rise (to PW) and quantity demanded falls (to QW, “climbing up the demand curve”) as supply shifts from S0 to SW. (Note that prices often lead to quantities, hence the arrows.)
This model separates causes and effects, which helps with planning, reactions, and so on. There are, of course, many responses that have affected (shifted) both supply and demand, but those came after the initial shock.
My one-handed conclusion is that it’s useful to have a logical means of understanding/explaining the everyday complexities of markets.

