July personal income and spending: more modestly good fallout from lower gas prices There was more good fallout from the recent decline in gas prices in today’s July report on personal income and spending. Personal income rose 0.2% for the month nominally, and nominal spending rose 0.1%. But because the relevant measure of inflation, the PCE deflator, declined -0.1%, real income rose 0.3% and real personal spending rose 0.2%. Meanwhile June’s income and spending numbers were revised higher and lower by 0.1% and -0.1%, respectively. This year I have been comparing both real personal income and spending with that with their level after early 2021’s round of stimulus as of May one year ago. Accordingly, the below graph is normed to 100 as of May
Topics:
NewDealdemocrat considers the following as important: personal income and spending, US EConomics
This could be interesting, too:
NewDealdemocrat writes JOLTS revisions from Yesterday’s Report
Bill Haskell writes The North American Automobile Industry Waits for Trump and the Gov. to Act
Bill Haskell writes Families Struggle Paying for Child Care While Working
Joel Eissenberg writes Time for Senate Dems to stand up against Trump/Musk
July personal income and spending: more modestly good fallout from lower gas prices
There was more good fallout from the recent decline in gas prices in today’s July report on personal income and spending.
Personal income rose 0.2% for the month nominally, and nominal spending rose 0.1%. But because the relevant measure of inflation, the PCE deflator, declined -0.1%, real income rose 0.3% and real personal spending rose 0.2%. Meanwhile June’s income and spending numbers were revised higher and lower by 0.1% and -0.1%, respectively.
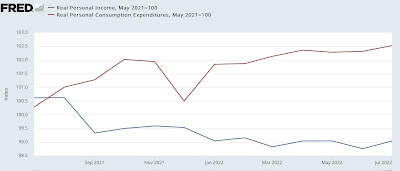
This year I have been comparing both real personal income and spending with that with their level after early 2021’s round of stimulus as of May one year ago. Accordingly, the below graph is normed to 100 as of May 2021:

Since then, real spending is up 2.5%, while real income has declined by -1.0%.
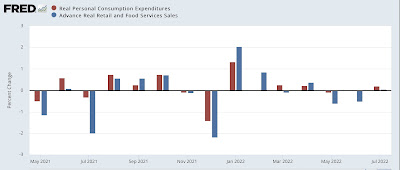
Comparing real personal consumption expenditures with real retail sales since May 2021(essentially, both sides of the consumption coin) shows that both were a hair above being flat in July:

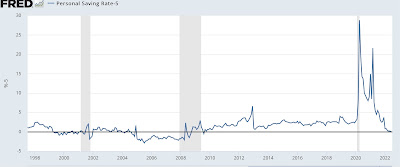
Finally, the personal saving rate was unchanged at 5.0%, tied with June for the lowest since right after the Great Recession in 2009 (note: below graph subtracts -5.0% to norm the current reading at zero):

This is the lowest since the end of the Great Recession. Only the ends of the 1990s boom and 2000s housing bubble were lower.
Usually the savings rate tends to decrease as expansions grow longer, leaving consumers more vulnerable to shocks. Recent months have suggested that consumers have been digging deeper into their savings in order to deal with higher gas prices. Which isn’t entirely bad news, since recessions typically start when consumers get spooked enough to increase their savings rate.
Instead, with gas prices having declined since June, consumers were probably a little more confident. This was a very modestly good report.
