Focusing on the short end of the yield curve – by New Deal democrat When most analysts talk about yield curve inversions, they typically mean a measure of the 10 year bond vs. a shorter maturity like 3 month or 2 years. These certainly have merit – in fact the 10 year minus 2 year inversion has typically had the longest lead time before recessions. But the NY Fed has written that special attention should be paid to the short end of the yield curve, i.e., 2 years and less. That is the portion of the yield curve that is most responsive to the Fed, and what the trajectory of the economy is likely to be in the next year or two. In general, once the shortest end inverts (i.e., Fed funds and 3 month maturities) vs. 1 and 2 year maturities, the
Topics:
NewDealdemocrat considers the following as important: politics, US EConomics
This could be interesting, too:
Robert Skidelsky writes Lord Skidelsky to ask His Majesty’s Government what is their policy with regard to the Ukraine war following the new policy of the government of the United States of America.
NewDealdemocrat writes JOLTS revisions from Yesterday’s Report
Joel Eissenberg writes No Invading Allies Act
Ken Melvin writes A Developed Taste
Focusing on the short end of the yield curve
– by New Deal democrat
When most analysts talk about yield curve inversions, they typically mean a measure of the 10 year bond vs. a shorter maturity like 3 month or 2 years. These certainly have merit – in fact the 10 year minus 2 year inversion has typically had the longest lead time before recessions.
But the NY Fed has written that special attention should be paid to the short end of the yield curve, i.e., 2 years and less. That is the portion of the yield curve that is most responsive to the Fed, and what the trajectory of the economy is likely to be in the next year or two. In general, once the shortest end inverts (i.e., Fed funds and 3 month maturities) vs. 1 and 2 year maturities, the bond market is pricing in a recession within that time period, because it is anticipating that the Fed will have to lower rates in that timeframe.
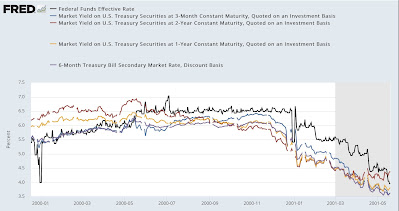
For example, here is the 2000-2001 timeframe:

In the first half of 2000, 1 and 2 year yields are higher than the very short term yields, but are tightening. By the second half of 2000, yields are completely flat across the range, and then fully inverted. By early 2001, as the Fed along with everyone else smelled that a recession was imminent, Fed rates came down, and only as the recession itself progressed did rates begin to normalize.
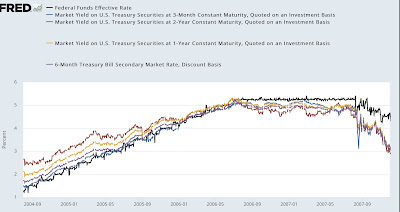
Here is 2005-2007:

Note the similar progression, as yield ranges tighten but remain positively sloped in 2004-05, but then flatten in spring 2006 before completely inverting later in the year. In 2007, as the Fed and the market smell a recession approaching, the Fed lowers rates, but the inversion persists.
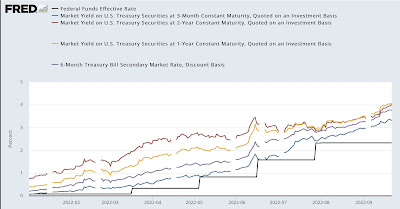
Now here is the present (note this week’s rate hike to 3.12% is still not shown in the Fed funds line):

Only the 1 vs. 2 year range has inverted. While all rates are rising, the shortest term remain positively sloped.
The yield curve is not perfect. As I have pointed out many times, there were at least 5 recessions between 1933 and 1957, when the Fed first started manipulating the Fed funds rate. In those cases there were no inversions. But at the moment the yield curve is almost alone among all indicators in not straightforwardly forecasting a recession in the next 6-12 months. The yield curve from 1 through 10 years out is completely inverted, and the 10 year is yielding less than the 6 month treasury. But the short end of the yield curve is still normally sloped.
