House prices: signs and portents of an approaching peak? House price increases were still going strong through March, as reported this morning in both the Case Shiller and FHFA house price indexes. The Case Shiller national index rose 2.1% for the month and 20.5% YoY, the biggest YoY% gain ever, while the FHFA purchase-only index rose 1.5% for the month, and 19.0% YoY. In the first graph below I also include the quarterly YoY% gain in the median price of all houses sold from the Census Bureau’s home sales report (gold), which increased 15.9% YoY: While both the FHFA and Case Shiller indexes are at or near record YoY gains, quarterly median house prices from the Census Bureau are down significantly from 21.8% YoY in Q3, which was the
Topics:
NewDealdemocrat considers the following as important: House prices, US EConomics
This could be interesting, too:
NewDealdemocrat writes JOLTS revisions from Yesterday’s Report
Bill Haskell writes The North American Automobile Industry Waits for Trump and the Gov. to Act
Bill Haskell writes Families Struggle Paying for Child Care While Working
Joel Eissenberg writes Time for Senate Dems to stand up against Trump/Musk
House prices: signs and portents of an approaching peak?
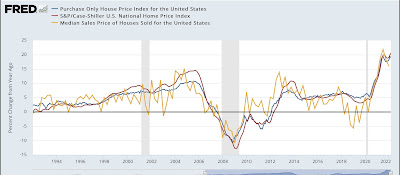
House price increases were still going strong through March, as reported this morning in both the Case Shiller and FHFA house price indexes. The Case Shiller national index rose 2.1% for the month and 20.5% YoY, the biggest YoY% gain ever, while the FHFA purchase-only index rose 1.5% for the month, and 19.0% YoY.
In the first graph below I also include the quarterly YoY% gain in the median price of all houses sold from the Census Bureau’s home sales report (gold), which increased 15.9% YoY:
While both the FHFA and Case Shiller indexes are at or near record YoY gains, quarterly median house prices from the Census Bureau are down significantly from 21.8% YoY in Q3, which was the highest YoY% gain since 1973. The FHFA gain also decreased slightly. These are of interest because the Census Bureau’s measure, while very noisy, tends to be the first to turn, and the FHFA has in the past slightly led the Case Shiller number.
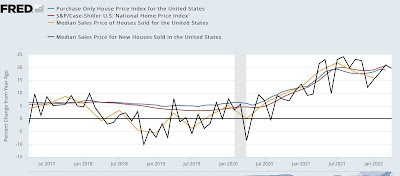
In this second graph below of the past 5 years, I also include the monthly median new home sales price from the Census Bureau (black):
The monthly number from the Census Bureau is *very* noisy, so I don’t put much much stock in any particular month, but the decelerating trend from last summer is clear.
Finally, while I can’t show you graphically the YoY% change in prices in existing homes from the NAR, since they only allow FRED to show one year, below are the YoY% changes for every month in median existing home sales prices for the past 12 months:
Apr 2021 +19.1%
May +23.6% [peak]
Jun +23%
Jul +20%
Aug +15%
Sep +13%
Oct +13.1%
Nov +13.9%
Dec 2021 +15.8%
Jan 2022+15.4%
Feb 2022 +15%
Mar 2022 +15%
Apr 2022 +10.4% [lowest]
Since the NAR data is not seasonally adjusted, the YoY% change is the only valid way to measure. My rule of thumb for non-seasonally adjusted data is that, when the YoY% change declines to less than half of its largest change, the peak (if we were able to seasonally adjust) has probably occurred. In April, that threshold was crossed – although so far only for one month.
In summary, the best seasonally adjusted data indicates that, through March, the surge in house prices was still ongoing. But the most leading data series, which unfortunately aren’t seasonally adjusted, show signs of a slowing in house price appreciation, and one data series – from the NAR – may indicate that prices, could we seasonally adjust, peaked in April, although I would definitely want to see if that is an anomaly, or if the trend continues in May and June.
Prices follow sales. And sales are down significantly. It would not surprise me if the peak in house prices happened this summer. But while we have some ambiguous signs and portents, we’re not there yet.


