Housing starts show continued strength in March, while single family permits indicate softness ahead The continued strength in total housing permits and starts shown in this morning’s report for March was surprising; but the series with the most signal and least noise, single family permits, betrayed weakness. While typically permits, especially single family permits, lead the series, in the past year, however, there has been a unique divergence between permits and starts, as supply shortages resulted in a delay in actually building houses that had been approved.Housing authorized but not started increased to yet another 50+ year record last month, at 290,000: In 2021 permits soared then sank, while starts held much more steady, due to the
Topics:
NewDealdemocrat considers the following as important: housing starts, US EConomics
This could be interesting, too:
NewDealdemocrat writes JOLTS revisions from Yesterday’s Report
Bill Haskell writes The North American Automobile Industry Waits for Trump and the Gov. to Act
Bill Haskell writes Families Struggle Paying for Child Care While Working
Joel Eissenberg writes Time for Senate Dems to stand up against Trump/Musk
Housing starts show continued strength in March, while single family permits indicate softness ahead
The continued strength in total housing permits and starts shown in this morning’s report for March was surprising; but the series with the most signal and least noise, single family permits, betrayed weakness.
While typically permits, especially single family permits, lead the series, in the past year, however, there has been a unique divergence between permits and starts, as supply shortages resulted in a delay in actually building houses that had been approved.
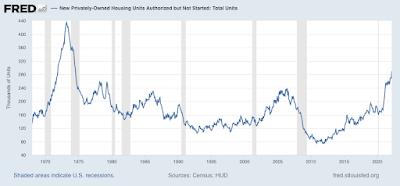
Housing authorized but not started increased to yet another 50+ year record last month, at 290,000:

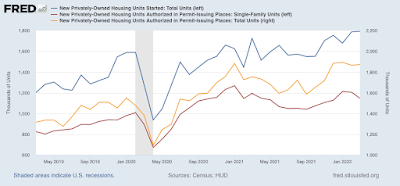
In 2021 permits soared then sank, while starts held much more steady, due to the above delay in the actual start of construction, as shown in the below graph of total housing starts (blue), total permits (gold), and single family permits (red, right scale) for the last 3 years:

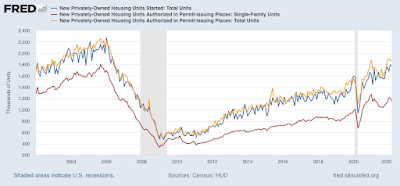
A longer term look shows the continued growth in actual starts, while also showing underlying weakness in single family permits:

The three month average for starts is the highest since 2006. Note, by the way, that a similar thing happened several times in the past decade, notably in early 2014 and 2016, as potential buyers rush to close before rates climb even higher.
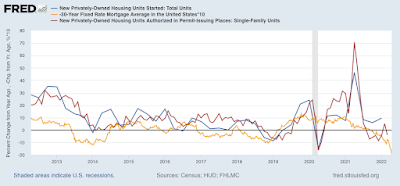
Two months ago, I wrote that “after this surge, which may persist another month or so, I fully expect housing starts and permits to decline, and substantially, in accord with the big increase in mortgage rates to over 4%, about 1.3% above their 2021 lows.” In terms of starts, the surge has certainly persisted.
But this look at the YoY% change in starts (blue, averaged quarterly to cut down on noise) and single family starts (red), vs. the YoY change in mortgage rates (inverted, *10 for scale), shows that, while starts have held up, still 5% higher YoY, single family permits, now down -4% YoY, have not:

In the coming months, I still expect to see a substantial decline in permits. Ordinarily, that would be a major negative long leading indicator. But actual construction starts are likely to continue to show strength until the near record backlog has been cleared. Since starts are the actual, hard economic activity, this indicates that housing is still going to make a positive to the economy looking out ahead 12 months.
In fairness, this is an amendment to what I wrote yesterday. Then I noted that there was no “pent-up demand” or “demographic tailwind” present anymore. That is true; but the backlog in construction due to supply shortages will delay any actual downturn affecting economic activity.
