July new home sales signal a recession is near Let’s start with reminders about new home sales data: 1. It is very noisy 2. It is heavily revised. But 3. It usually leads at peaks and troughs. With that in mind, unless today’s new home sales data for July is revised away, it is very significant. First of all, June’s sales data was indeed revised slightly lower from 590,000 to 585,000. More significantly, the median price of a new home, originally reported at +7.2% YoY, was revised higher to +10.7%. In July, new home sales declined to 511,000 at an annualized pace. That is the lowest since January 2016. It is also 49.3% off its peak of 1.036 million in August 2020. Here is the long term view since the start of the data in the
Topics:
NewDealdemocrat considers the following as important: US EConomics
This could be interesting, too:
NewDealdemocrat writes JOLTS revisions from Yesterday’s Report
Bill Haskell writes The North American Automobile Industry Waits for Trump and the Gov. to Act
Bill Haskell writes Families Struggle Paying for Child Care While Working
Joel Eissenberg writes Time for Senate Dems to stand up against Trump/Musk
July new home sales signal a recession is near
Let’s start with reminders about new home sales data:
1. It is very noisy
2. It is heavily revised.
But
3. It usually leads at peaks and troughs.
With that in mind, unless today’s new home sales data for July is revised away, it is very significant.
First of all, June’s sales data was indeed revised slightly lower from 590,000 to 585,000. More significantly, the median price of a new home, originally reported at +7.2% YoY, was revised higher to +10.7%.
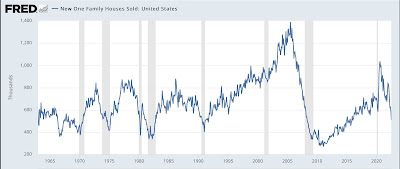
In July, new home sales declined to 511,000 at an annualized pace. That is the lowest since January 2016. It is also 49.3% off its peak of 1.036 million in August 2020. Here is the long term view since the start of the data in the 1960s:

This is simply a huge decline. Typically a decline of only 33% from peak has been enough to indicate the imminent onset of a recession. The only bigger decline was the housing bust from 2005-07.
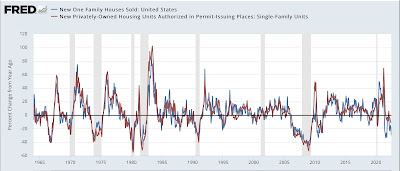
The YoY data tells the same story. The only similar YoY% declines that did not signal recessions were in 1966 and 2010:

I’ve included the far less noisy single family permits (red) in the above graph as well. Permits tend to lag by a month or two, and are currently only down -11.3%. Again, unless today’s data is revised away, it is likely permits will be down over -20% YoY within several months, which also has almost always signaled an oncoming recession.
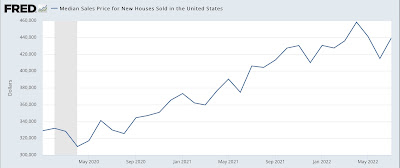
Finally, the median price of a new home rose on a monthly basis to $439,400, below April’s peak of $458,200:

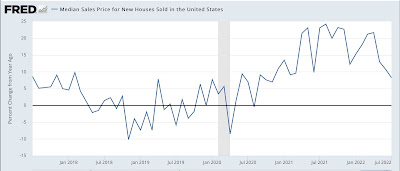
But because price data is not seasonally adjusted, the best way to look at it is YoY. My rule of thumb is that, when YoY growth is less than half of the peak in the past 12 months, the measure (if we could seasonally adjust it) has probably peaked.
YoY prices in July increased 8.2%, only about 1/3rd of the 24.2% YoY increase last August:

This tells us the prices most likely peaked in May, the last time the YoY% increase was more than half of the peak. Even with the upward revision to June, averaging the last 2 or 3 months of price data yields a result more than 50% below the peak average 2 or 3 months of price data from last summer.
In summary: sales have continued to fall, prices have now likely turned down, and inventory can be expected to continue to increase. Further, the decline in sales is so severe that, unless very heavily revised upward, it almost certainly means a recession is near.
