New home sales surge, while house price measures decelerate; expect deceleration or even downturns in each Since I didn’t post yesterday, let me catch up today with a note on both new home sales and prices.New home sales (blue in the graph below) for December rose sharply to 811,000 on an annualized basis. This is the higher monthly number since March, and while it is well above the trend since the Great Recession, it is still well below its levels from late 2020: The red line is inventory. When it comes to new homes, inventory lags not only sales but also prices, so it is not surprising that inventory has increased sharply to a 10 year+ high. While new home sales are the most leading of all housing metrics, they are very noisy and heavily
Topics:
NewDealdemocrat considers the following as important: Housing Prices, US EConomics
This could be interesting, too:
NewDealdemocrat writes JOLTS revisions from Yesterday’s Report
Bill Haskell writes The North American Automobile Industry Waits for Trump and the Gov. to Act
Bill Haskell writes Families Struggle Paying for Child Care While Working
Joel Eissenberg writes Time for Senate Dems to stand up against Trump/Musk
New home sales surge, while house price measures decelerate; expect deceleration or even downturns in each
Since I didn’t post yesterday, let me catch up today with a note on both new home sales and prices.
New home sales (blue in the graph below) for December rose sharply to 811,000 on an annualized basis. This is the higher monthly number since March, and while it is well above the trend since the Great Recession, it is still well below its levels from late 2020:
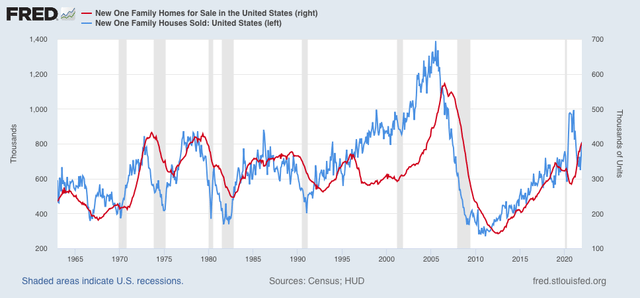
The red line is inventory. When it comes to new homes, inventory lags not only sales but also prices, so it is not surprising that inventory has increased sharply to a 10 year+ high.
While new home sales are the most leading of all housing metrics, they are very noisy and heavily revised. So in the below graph I compare them with single-family permits (red), which have also increased in the last few months, but also are not at 2020 levels:
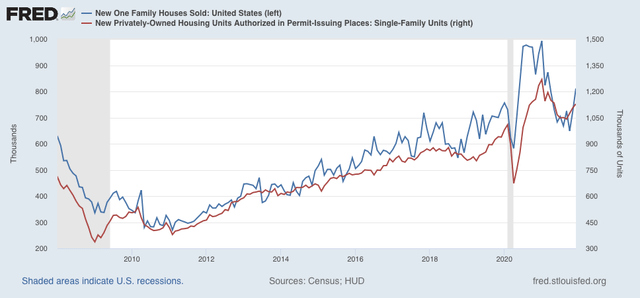
Because mortgage rates have increased significantly in the past several months, I do not expect this surge in new home buying to last much longer.
Sales lead prices, and for most of 2021 sales were down. So it should not be a surprise that on a YoY basis, price increases are at last abating, shown both monthly (blue) and quarterly (black) in the graph below:
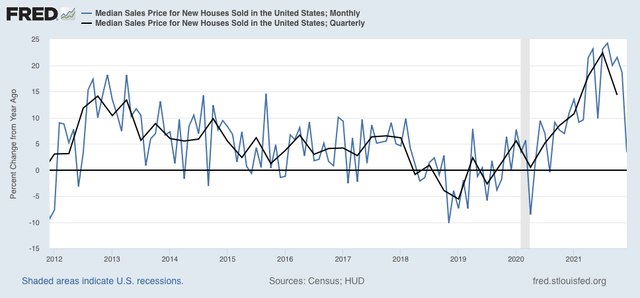
In December, prices were only up 3.4% from one year prior. Since the data is noisy on a monthly basis, the quarterly number, still high at just under 15%, but well below the sharp gains earlier in the year, is more telling.
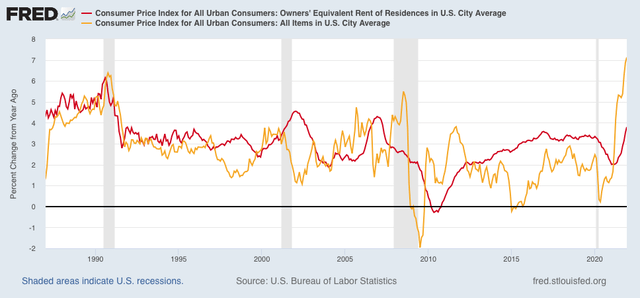
The deceleration in YoY price gains, which nevertheless are still very high, was also the story yesterday in both the Case Shiller and FHFA house price indexes (light and dark blue in the graph below, /2 for scale). Also shown are the YoY% gains in rent of primary residence and owner’s equivalent rent (how the CPI measures housing inflation)(light and dark red):
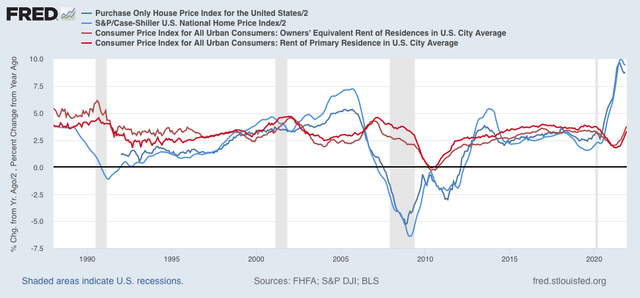
My purpose in the above graph is to show that both house price indexes track one another closely, as do both “official” measures of housing inflation. Additionally, as I’ve previously pointed out, house price increases tend to bleed over into the official inflation measures with about a 12 to 18 month lag. Thus on a YoY basis price increases bottomed in 2019, but did not bottom in the official measures of rent until the beginning of 2021. Since the YoY% increase in house prices peaked in mid year 2021, we can expect the “official” CPI housing measure to continue to increase on a YoY basis through roughly late 2022.
This doesn’t necessarily mean that the *total* inflation measure will continue to increase throughout this year. Below I again show the YoY% change in owners’ equivalent rent as above, but also the total inflation index (gold). Most importantly, note that sometimes they track in tandem, but also that generally during the entire house price boom, bubble, and bust from 1995 to 2015 they tended to move in opposite directions:
Why did this happen? Sometimes, as during 1995-2015, home ownership and apartment renting are alternative goods. When more people decide to leave apartments and move into houses, house prices increase while rents flatten. This is generally what happened during the boom and bubble. Then during the bust people were forced to abandon houses and move back into apartments. This is shown in the below graph of homeownership:
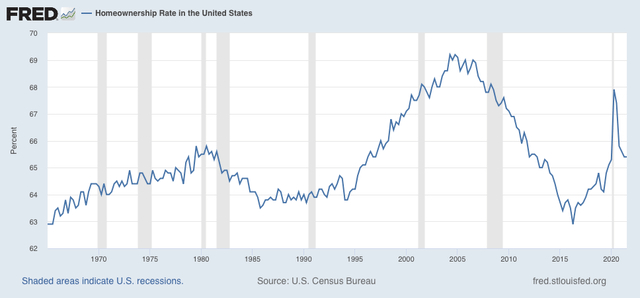
Note the huge upward surge until the housing bubble popped, followed by the equally sharp deflation.
Finally, let’s factor in interest rates set by the Fed, shown in black below:
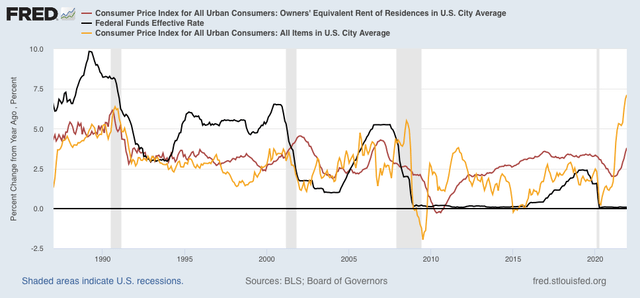
As CPI increases, the Fed typically increases interest rates. By the time the fully effect in owners’ equivalent rent is felt, Fed rate hikes have typically cooled the economy, meaning that the remaining majority of the overall consumer inflation index declines.
Bringing our discussion back to the present, we see that total inflation has been rising sharply since just after the pandemic hit. Owners’ equivalent rent started to rise about 9 months ago. Part of the delay was the big increase in the homeownership rate during that time, driving rents and house prices in opposite directions. The consensus is that the Fed will raise rates several times this year, perhaps starting as early as this spring. If they indeed do so, they will probably continue to embark on hiking rates until the economy slows or even reverses, enough so that price increases – other than rents – decelerate considerably. But while rent measures will continue to accelerate this year, house price increases themselves are likely to continue to decelerate, or even stall in the months ahead.