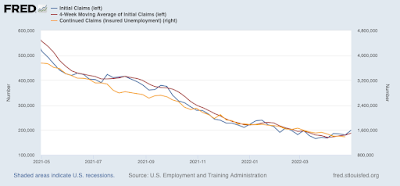
Initial jobless claims rose 19,000 to 200,000, continuing above the recent 50+ year low of 166,000 set in March. The 4 week average also rose by 8,000 to 188,000, compared with the all-time low of 170,500 set four weeks ago. On the other hand, continuing claims declined -19,000 to 1,384,000, yet another new 50 year low (but still well above their 1968 all-time low of 988,000): The “job openings” component of the March JOLTS report released on Tuesday, indicated that there was no abatement in the number of employers participating in the new game of employment “musical chairs.” But the graph above shows a slight trend of increased new layoffs, which might just be noise. Or maybe not.
Topics:
NewDealdemocrat considers the following as important: new jobless claims, US EConomics
This could be interesting, too:
NewDealdemocrat writes JOLTS revisions from Yesterday’s Report
Bill Haskell writes The North American Automobile Industry Waits for Trump and the Gov. to Act
Bill Haskell writes Families Struggle Paying for Child Care While Working
Joel Eissenberg writes Time for Senate Dems to stand up against Trump/Musk
Initial jobless claims rose 19,000 to 200,000, continuing above the recent 50+ year low of 166,000 set in March. The 4 week average also rose by 8,000 to 188,000, compared with the all-time low of 170,500 set four weeks ago. On the other hand, continuing claims declined -19,000 to 1,384,000, yet another new 50 year low (but still well above their 1968 all-time low of 988,000):

The “job openings” component of the March JOLTS report released on Tuesday, indicated that there was no abatement in the number of employers participating in the new game of employment “musical chairs.” But the graph above shows a slight trend of increased new layoffs, which might just be noise. Or maybe not.
