Coronavirus dashboard for March 8: Omicron looks like it has burned through all of the “dry tinder,” leaving perhaps only 10% of the US population still fully vulnerable to infection Back in autumn when Delta was raging, I thought that, once it burned through all of the “dry tinder,” so many unvaccinated people would have been infected that cases would dwindle due to there being so few unvaccinated and uninfected people left. Well, it appears that Omicron may have done what I thought Delta was going to do. As of yesterday, cases in the US decreased to 42,000, a decline of over 33% in the last week, almost 95% from their Omicron peak, and the lowest since late last July. Deaths decreased to 1380, a decline of over 25% in the last week, and of
Topics:
NewDealdemocrat considers the following as important: Healthcare, omicron
This could be interesting, too:
Bill Haskell writes Families Struggle Paying for Child Care While Working
Joel Eissenberg writes RFK Jr. blames the victims
Joel Eissenberg writes The branding of Medicaid
Bill Haskell writes Why Healthcare Costs So Much . . .
Coronavirus dashboard for March 8: Omicron looks like it has burned through all of the “dry tinder,” leaving perhaps only 10% of the US population still fully vulnerable to infection
Back in autumn when Delta was raging, I thought that, once it burned through all of the “dry tinder,” so many unvaccinated people would have been infected that cases would dwindle due to there being so few unvaccinated and uninfected people left.
Well, it appears that Omicron may have done what I thought Delta was going to do.
As of yesterday, cases in the US decreased to 42,000, a decline of over 33% in the last week, almost 95% from their Omicron peak, and the lowest since late last July. Deaths decreased to 1380, a decline of over 25% in the last week, and of almost 50% from their Omicron peak. Still, deaths are lagging cases by slightly over a month. If deaths were to decline 95% from peak as well, that would be only about 130 per day in a month, equivalent to their lows last June.
Here is what cases (dotted line) and deaths (solid line) look like for the past 6 months:
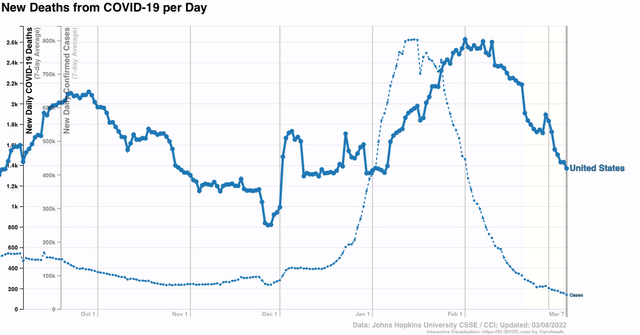
This shows just how dramatically the Omicron tsunami rolled in and has rolled out as well.
But now, here is the same information about cases, with only values at or below the current number of cases shown, all the way back to the start of the pandemic:
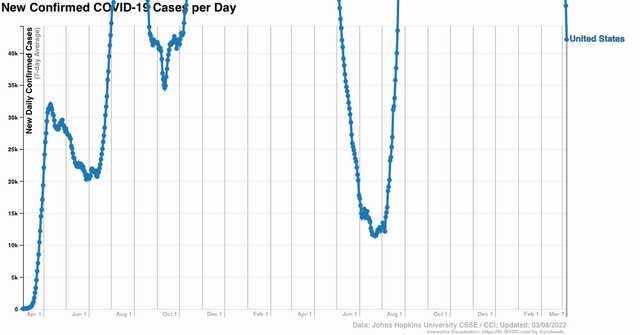
While as stated above, cases are back to a level last seen 8 months ago, they remain higher than at almost all times during the first 7 months of the pandemic in 2020. Still, cases are probably going to continue to decline, because typically the reversal of trend will emerge in just a few States first and then gradually spread out. But as of now, only two States – Connecticut and Alabama – have more cases than one week ago, and in both of those States, the reason appears to be a data dump.
So if deaths continue to decline in line with cases, by 95% from their peak, that would take us down to only 130 deaths per day in a month or so – a level equivalent to the very best numbers last June.
A little over a week ago, the CDC reported that
“More than 140 million Americans have had the coronavirus, according to estimates from blood tests that reveal antibodies from infection – about double the rate regularly cited by national case counts.
“The blood tests count only antibodies from natural infection, including asymptomatic cases, not from vaccination. The study measures the presence of antibodies. It does not indicate whether there is strong protection against subsequent infection.
“Infection rates are much higher for children and younger adults, the study found. It estimated that 58 percent of children up to age 11 have antibodies from natural infection, along with the same share of children age 12 to 17.
“Just under half of adults up to 49 have been infected, the CDC estimates. The rate drops to 37 percent for people 50 to 64 and 23 percent of people 65 or older:
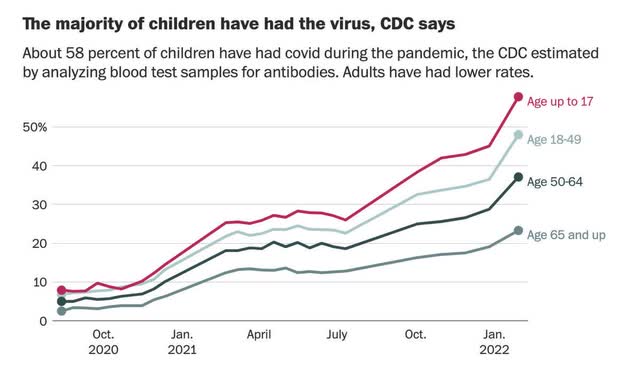
“As of late November, just before the omicron variant began spreading in the United States, the blood test study estimated that 103 million people had been infected. By that measure, 37 million new people caught the virus over two months ending in late January. [which is when the data was last collected].”
Late January was just as the Omicron tsunami was peaking. Since then, about another 10 million, or 3%, of the entire US population has had a *confirmed* case of Covid:
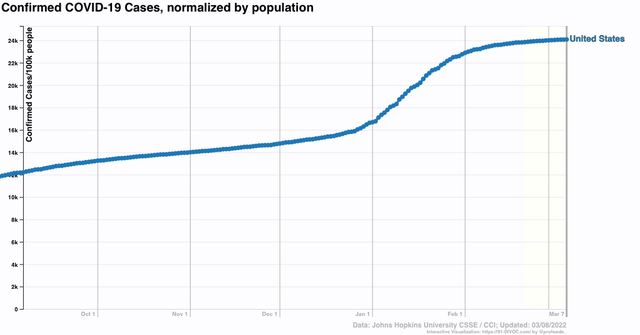
Note that only 21% of the US population had a confirmed case as of late January, vs. about 42% as estimated by the CDC as of that time; thus, it is likely that an additional 3% has had an *un*confirmed case since then, on top of the 3% confirmed new cases. This gives us a total of 48% (round it to 50%) of the entire US population at some point has been infected by COVID.
In the past, for simplicity sake I have estimated that infections were randomly split between those not vaccinated, or not yet vaccinated when infected, and those already vaccinated.
In view of the CDC study above, showing that infections have occurred considerably more often among those younger age groups who have had a lower vaccination rate, a more likely ratio is probably something like 2:1 infections having occurred among the unvaccinated vs. the vaccinated. In other words, not just 50% of the unvaccinated have been infected, but probably 2/3’s, or 67%, have been infected.
Now consider that, according to the CDC, 65.1% of the entire US population has had two doses of the vaccine, and 76.5% has had at least one shot:
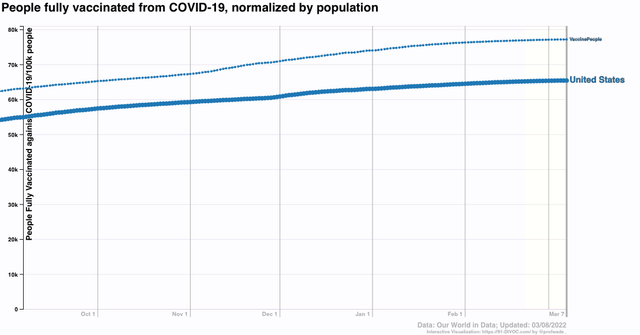
What does this mean? A COVID virus particle, when inhaled in the US, has a 65% chance, or almost 2/3’s of it being a fully vaccinated person.
Among the remaining 35%, at a ratio of 2:1 infections unvaccinated vs. vaccinated, that means there’s probably another 23% (2/3’s of 35%) chance (rounded to 25%) that it is being inhaled by someone who, while not vaccinated, has already had a COVID infection and has at least some resistance. And at least some percentage of those have had one shot of vaccine.
In short, that COVID virus particle has only about a 10% chance of being inhaled by someone with no resistance at all due to vaccination or prior infection. That would show up in a severe decline in new cases to a very low level – which looks to be very likely what we are seeing right now.
It’s a near certain bet that there will be new variants of COVID in the future, and that resistance especially among the unvaccinated will wane over time. But I suspect that there will be a spring respite this year, and increasingly longer respites to come in between waves of gradually decreasing severity in the future.
