No economic data today (May 16) of significance; but tomorrow one of my favorite economic indicators, retail sales, will be reported for April. Since real retail sales lead employment and generally are a short leading indicator for the economy as a whole, I wanted to update on what I see as their importance right now. Here are real retail sales per capita (red) vs. real aggregate payrolls per capita (blue), both normed to 100 as of last May (note: I chose May because of the stimulus fueled spending spree in March and April that abated by then): As you can see, payrolls have continued to grow by about 10% since then, while real retail sales per capita have for all intents and purposes been flat for the 10 months since, up only 0.3% as
Topics:
NewDealdemocrat considers the following as important: US EConomics
This could be interesting, too:
NewDealdemocrat writes JOLTS revisions from Yesterday’s Report
Bill Haskell writes The North American Automobile Industry Waits for Trump and the Gov. to Act
Bill Haskell writes Families Struggle Paying for Child Care While Working
Joel Eissenberg writes Time for Senate Dems to stand up against Trump/Musk
No economic data today (May 16) of significance; but tomorrow one of my favorite economic indicators, retail sales, will be reported for April. Since real retail sales lead employment and generally are a short leading indicator for the economy as a whole, I wanted to update on what I see as their importance right now.
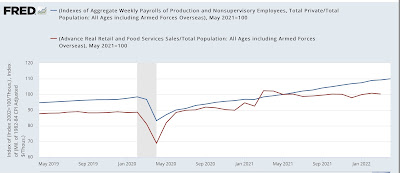
Here are real retail sales per capita (red) vs. real aggregate payrolls per capita (blue), both normed to 100 as of last May (note: I chose May because of the stimulus fueled spending spree in March and April that abated by then):
As you can see, payrolls have continued to grow by about 10% since then, while real retail sales per capita have for all intents and purposes been flat for the 10 months since, up only 0.3% as of March.
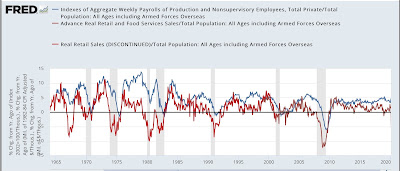
Why is this important? Here is a look at the same two metrics going back 60 years measured YoY:
Two important relationships ought to jump out. First, while the relationship is noisy on a monthly basis, over the longer term real retail sales lead payrolls, usually on the order of about 6 months. Second, real retail sales being negative YoY for any sustained period of time is an excellent harbinger of recession. Not only have they turned negative YoY in advance of every recession in the past 50+ years, but on the few occasions where a recession did not follow a negative number that was sustained for more than a month or two – 1966, 1987, 1994, 2002 – there was a marked economic slowdown that was not far off from recession.
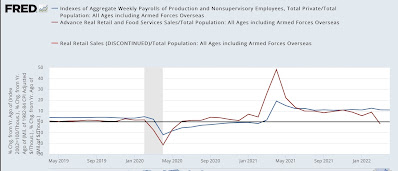
Now let’s take a look at the same numbers for the past 3 years:
Note that payrolls were up 20% YoY in April 2021, and real retail sales jumped 50%! Since the biggest previous advance was about 12% YoY, had I included this data in the long term chart above, everything else would have been squiggles.
Note also that real retail sales per capita were negative YoY in March. They will presumably remain negative in April because they are being compared with the stimulus spending spree last April. For purposes of a pre-recession marker, the real marker is whether they will be down compared with last May, after the spending spree. Since consumer prices increased 0.3% in April, retail sales must increase 0.3% just to keep pace. A decline of -0.4% or more would make them negative compared with last May.
Because my suite of long leading indicators has not indicated a recession this year, I am expecting real retail sales to escape such a negative reading. But not necessarily by much. At the moment, they are forecasting a marked slowdown in the economy continuing this year. We’ll get the update tomorrow.


