Coronavirus dashboard for April 13: watching the BA.2 “bump” The BA.2 “bump” (h/t Dr. Eric Topol) is upon us (and hopefully a “bump” is all it is). Let’s take a look at where we stand. Cases bottomed 8 days ago at 28,378. As of yesterday, they had increased to 32,835: Hospitalizations have continued to decline, and at 9859 are the lowest since March 2020 when the pandemic was just beginning: Deaths are at 527, just above their 10 month low of 498 the previous day. Only in June and July 2021 have deaths been lower than this. The below graph shows the long term view of both deaths (bold line) and cases (thin line), scaled separately: Each successive wave has been *relatively* less lethal (i.e., deaths vs. cases)
Topics:
NewDealdemocrat considers the following as important: BA.2, COVID-19, Healthcare
This could be interesting, too:
Bill Haskell writes Families Struggle Paying for Child Care While Working
Joel Eissenberg writes RFK Jr. blames the victims
Joel Eissenberg writes The branding of Medicaid
Bill Haskell writes Why Healthcare Costs So Much . . .
Coronavirus dashboard for April 13: watching the BA.2 “bump”
The BA.2 “bump” (h/t Dr. Eric Topol) is upon us (and hopefully a “bump” is all it is). Let’s take a look at where we stand.
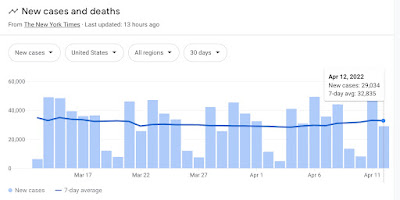
Cases bottomed 8 days ago at 28,378. As of yesterday, they had increased to 32,835:
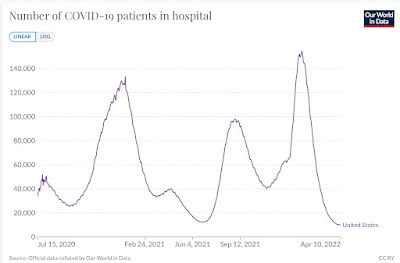
Hospitalizations have continued to decline, and at 9859 are the lowest since March 2020 when the pandemic was just beginning:
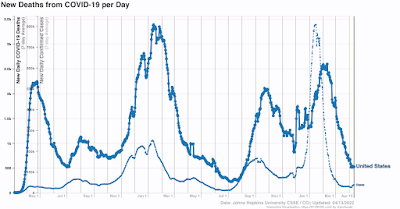
Deaths are at 527, just above their 10 month low of 498 the previous day. Only in June and July 2021 have deaths been lower than this. The below graph shows the long term view of both deaths (bold line) and cases (thin line), scaled separately:
Each successive wave has been *relatively* less lethal (i.e., deaths vs. cases) than the previous one, with the exception (slightly) of Delta last summer. Note there was a slight increase – a “bump” in Topol’s terminology – last April, during Alpha, that was focused on Michigan.
I suspect this is because ever-increasing percentages of the population have been vaccinated and/or infected, priming the body’s immune system for a better response.
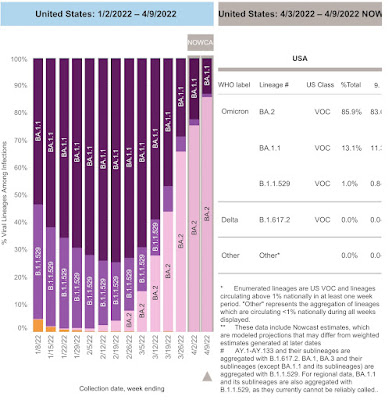
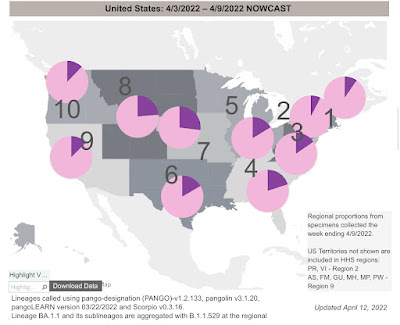
The CDC reported yesterday that as of last week BA.2 accounted for 86% of all new infections:
Regionally, in the Northwest and Southwest BA.2 is 88% of new cases; in the upper Midwest it is 84%; in New England it is 90%; and in NY and NJ it is 92%:
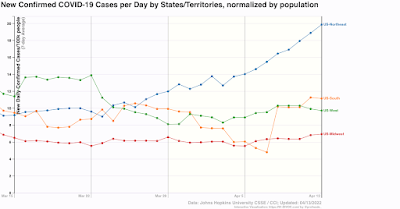
Here’s what the level of new cases looks like broken down by Census Region:
As you can see, cases are rising in every region (except for the South, where the last few days’ increase is due to a data dump by Texas – otherwise it is still decreasing). Cases started increasing in the Northeast first, 4 weeks ago, and that region has the biggest increase.
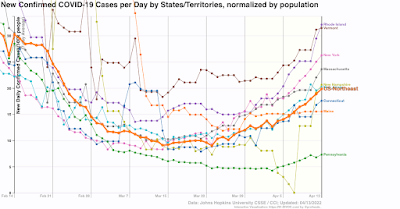
Because BA.2 started earlier and has been furthest along in the Northeast, and because in Europe BA.2 cases have typically peaked once BA.2 in the country reached 90% of all cases, here is a more detailed breakdown of the Northeastern States over the past 8 weeks:
So far there is no sign of BA.2 peaking in any of those States. Since in European countries the turnaround tended to occur quickly, as in within a week, hopefully we will start to see signs of a peak in some Northeastern States shortly.

