Properly measured, consumer inflation is only about 3.0% YoY, and the economy has experience Deflation since last June – by New Deal democrat One month ago, I “officially” took the position that inflation had been conquered, and that, properly measured, the economy had actually been experiencing deflation since last June. This morning’s report only confirmed that position. The primary reason, as I have been pounding on for almost 18 months, is that the shelter component of official inflation, which is 1/3rd of the total, and 40% of the “core” measure, badly lags the real data – as in, by a year or more. Before we get into all that, let’s look at the headlines, with the monthly and YoY rates of change: Total CPI up 0.1% m/m and 5.0%
Topics:
NewDealdemocrat considers the following as important: politics, US EConomics
This could be interesting, too:
Robert Skidelsky writes Lord Skidelsky to ask His Majesty’s Government what is their policy with regard to the Ukraine war following the new policy of the government of the United States of America.
NewDealdemocrat writes JOLTS revisions from Yesterday’s Report
Joel Eissenberg writes No Invading Allies Act
Ken Melvin writes A Developed Taste
Properly measured, consumer inflation is only about 3.0% YoY, and the economy has experience Deflation since last June
– by New Deal democrat
One month ago, I “officially” took the position that inflation had been conquered, and that, properly measured, the economy had actually been experiencing deflation since last June. This morning’s report only confirmed that position.
The primary reason, as I have been pounding on for almost 18 months, is that the shelter component of official inflation, which is 1/3rd of the total, and 40% of the “core” measure, badly lags the real data – as in, by a year or more.
Before we get into all that, let’s look at the headlines, with the monthly and YoY rates of change:
Total CPI up 0.1% m/m and 5.0% YoY
Core CPI up 0.4% m/m and 5.6% YoY
Owners Equivalent Rent up 0.5% m/m and 8.0% YoY
CPI less shelter up +0.2% and 3.4% YoY
Energy down -3.5% m/m and -6.4% YoY
Food unchanged m/m and 8.5% YoY
New cars up 0.4% m/m and 6.1% YoY
Core inflation is being driven by Owners’ Equivalent rent (shelter) and new cars. Total inflation is also being driven by food. But because shelter is such a large component of the aggregate, even including new cars and food leaves consumer inflation at a YoY rate that ought to be in the Fed’s comfort zone.
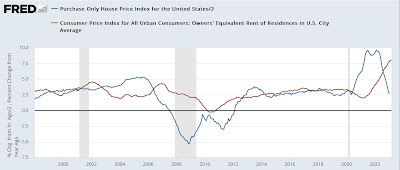
So let’s start with an updated long term YoY graph of the big culprit, Owner’s Equivalent Rent (red), which increased another 0.5% in February, with the FHFA house price index (blue, /2 for scale), which has been declining since last June and stood at 5.2% as of its last reading for January:

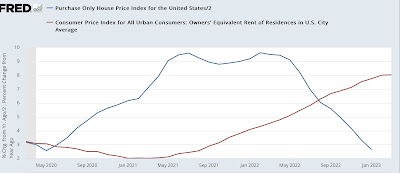
Here are the last 3 years for the close-up look:

The *relatively* good news s that OER appears to be leveling out, right on schedule about one year after house prices. If the FHFA index has continued to decline in the 2 months since then, it is only up about 2.3% YoY currently, vs. 8.0% for OER. If the FHFA index were substituted for OER, then total YoY CPI for March would only be 3.1%. Core inflation, which ex-shelter is up 3.5%, would only be up 3.0% if the FHFA house price index were substituted for OER.
There is no reason for the Fed to be raising rates if properly measured total CPI is increasing only 3.1% YoY, and core CPI is up only 3.0% YoY.
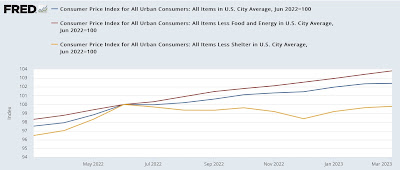
But it gets even worse, because last June, when house prices peaked and gas prices reached $5/gallon, was an inflection point. So the below graph norms total and core inflation as well as CPI less shelter, to 100 as of that month. Here’s what inflation since then looks like:

Total inflation is up 2.4% in the last 9 months, or at an annual rate of 3.2%.
Core inflation us up 3.8% in the last 9 months, for an annual rate of 5.1%.
Consumer prices ex-shelter are in *deflation,* down -0.2% in the past 9 months, for an annual rate of -0.3%.
Because the FHFA house price index is down -0.6% in the 7 months since June through January, if it were projected forward through March, it would be down -0.8% in the past 9 months.
In other words, consumer prices ex-shelter, plus shelter properly measured, indicates that the economy has been in outright *deflation* over the past 9 months.
And yet the Fed is still contemplating further rate hikes.
Inflation is Falling Faster Than People Know; Fed’s Response to Inflation Poses a Bigger Threat, Angry Bear, New Deal democrat.
