The 2 big reasons (one obvious, one subtle) why real median household income declined in 2022 – by New Deal democrat Last week, with its usual very big lag, median household income was reported by the Census Bureau for 2022. If, given big wage gains and hiring in 2022, you were expecting a significant increase, well, that didn’t happen. Instead, real median household income declined -2.3% from ,330 in 2021 to ,580: Unsurprisingly, the WSJ was out of the box with an article crowing that it showed the failure of Bidenomics. And maybe more surprisingly, there has been little debunking from the progressive side. Since I am all about the data, and letting the chips fall where they may, I decided to take my own in depth look. So, why did
Topics:
NewDealdemocrat considers the following as important: 2022, household income, US EConomics
This could be interesting, too:
NewDealdemocrat writes JOLTS revisions from Yesterday’s Report
Bill Haskell writes The North American Automobile Industry Waits for Trump and the Gov. to Act
Bill Haskell writes Families Struggle Paying for Child Care While Working
Joel Eissenberg writes Time for Senate Dems to stand up against Trump/Musk
The 2 big reasons (one obvious, one subtle) why real median household income declined in 2022
– by New Deal democrat
Last week, with its usual very big lag, median household income was reported by the Census Bureau for 2022. If, given big wage gains and hiring in 2022, you were expecting a significant increase, well, that didn’t happen. Instead, real median household income declined -2.3% from $76,330 in 2021 to $74,580:
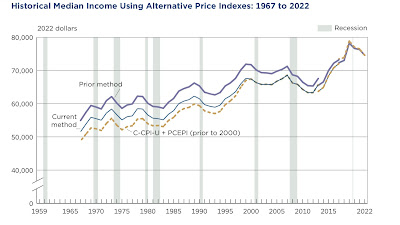
Unsurprisingly, the WSJ was out of the box with an article crowing that it showed the failure of Bidenomics. And maybe more surprisingly, there has been little debunking from the progressive side.
Since I am all about the data, and letting the chips fall where they may, I decided to take my own in depth look. So, why did real median household income fall last year? There were two big reasons, one glaringly obvious, the other surprisingly subtle.
1. There were no COVID stimulus payments in 2022.
In 2020 and 2021, there were 3 rounds of COVID stimulus payments to almost all households. That’s a big reason why in 2020, despite massive job losses, real median household income only declined -2.0%. There were smaller stimulus payments in spring 2021, that helped real median household income hold up, relatively speaking, declining only -0.4%.
The stimulus payments in 2021 were $1400 per household member up to $2800. Even the smaller amount was equivalent to 1.8% of real median household income in 2021.
In 2022, those disappeared. So right off the bat, a decline in real median household income in the range of -1.8% to -3.6% might be expected.
And the Census Bureau confirmed the same, right on page 1 of its report:
“Real median post-tax household income exhibited a substantial decline in 2022 from 2021. This was due in part to the expiration of policies introduced in response to the COVID-19 pandemic, such as Economic Impact Payments and the expanded Child Tax Credit.”
It would be nice to know what real median household income would have been leaving aside the stimulus payments, but unfortunately that information is not contained in the report. But a -2.3% decline after payments of 1.8% or more of income ended is hardly out of the ballpark.
But the Census Bureau’s report does provide important further detail, because they *also* calculated real median household income based on wage and salary payments alone. Here’s what the page 1 summary said about those:
“The real median earnings of all workers (including part-time and full-time workers decreased 2.2% between 2021 and 2022, while median earnings of those who worked full-time, year round decreased 1.3:”
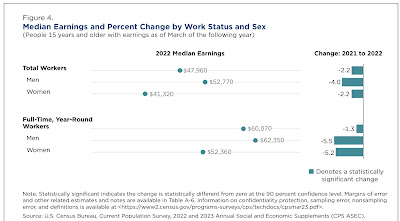
This is more problematic at first, but leads us to the second, surprising big reason that median income declined:
2. The -6.1% decline in the broad stock market.
A big stock market decline is exactly what we *wouldn’t* expect to be behind a decline in earnings. But it comes in through the back door via a big decline in the vesting of stock options.
The first clue is that the lower quintiles of households generally did *better* in 2022 than 2021:
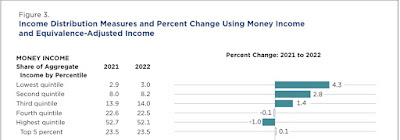
Here’s how the Census Bureau defines “income” on page 19 of the report (with some summary headers by me):
“[Wages, salaries, and other employment compensation:]
1. Earnings.
[Govenment transfer payments:]
2. Unemployment compensation.
3. Workers’ compensation.
4. Social Security.
5. Supplemental Security Income.
6. Public assistance.
7. Veterans’ payments.
8. Survivor benefits.
9. Disability benefits.
[Deferred employment compensation:]
10. Pension or retirement income.
[Investment income:]
11. Interest.
12. Dividends.
13. Rents, royalties, and estates and trusts.
[Other transfer payments:]
14. Educational assistance.
15. Alimony.
16. Child support.
[Miscellaneous others:]
17. Financial assistance from outside of the household.
18. Other income.”
First and foremost, note that investment income (but not capital gains) are included in the calculation of household income. While interest payments of *existing* investments generally did not benefit from the increase in rates, so did not raise income, the big decline in the stock market certainly *did* affect some dividend payments, as firms that are not doing well tend to cut or even forego dividends. That is going to take a chunk of income out of the leisure class, which did the worst in 2022.
But that isn’t the whole story, because remember that “earnings” alone declined in 2022. But it turns out that regular wage and salary payment omit a significant chunk of “earnings.” That’s because the vesting of stock options are frequently counted as earnings, as indicated by the IRS:
“You have taxable income or deductible loss when you sell the stock you bought by exercising the option. You generally treat this amount as a capital gain or loss. However, if you don’t meet special holding period requirements, you’ll have to treat income from the sale as ordinary income. Add these amounts, which are treated as wages, to the basis of the stock in determining the gain or loss on the stock’s disposition.”
When the stock market goes down, as it did in 2022, fewer stock options meet vesting requirements, which are usually tied to an increase in the company’s stock price. Less vesting means less cashing in, which means less income reported.
How big a deal was that in 2022? While we don’t have national figures, California does keep track of this, and its Department of Revenue noted how important it was last year. Let me give a little background first.
As you probably recall, I keep close track of tax withholding payments, which are based on earnings and, because of Social Security and Medicare caps, are not as distorted as other measures might be by billionaires’ compensations.
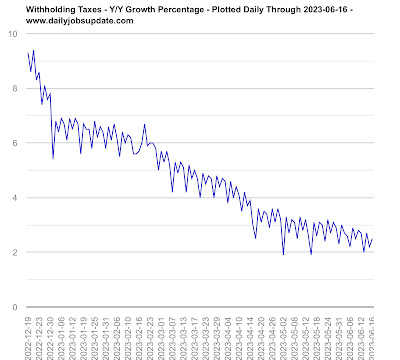
And in the last 4 months of 2022, tax withholding payments were virtually unchanged, even in nominal terms (i.e., before the 7.9% CPI increase), from the equivalent months in 2021, as shown in the below graph of the monthly YoY% changes for the past serval years:
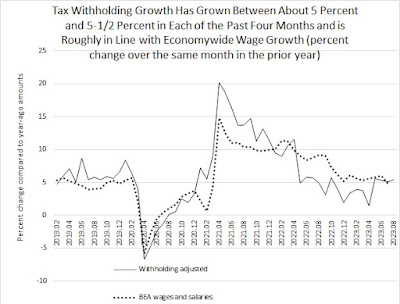
Matt Trivisonno helpfully keeps track of the YoY% change of the entire previous 365 days of withholding payments, and as you can see from the below graph, for the entirety of 2022, withholding payments were only about 6.5% higher than 2021, i.e., about a -1.4% decline:
Additionally, the QCEW is a virtual census of all job gains and losses, and wage and salary payments for all employers. It is updated quarterly. For the 4 quarters of 2022, in chronological order the YoY% changes in payments were: +6.7%, +4.3%, +6.7%, and -2.3%. The 4 quarter average was +3.85%, well below the inflation rate.
Now let’s go back to California. Its Department of Revenue periodically updates how well its income tax withholding collections are doing in comparison with previous budget estimates. And in the last quarter of 2022, they fell off a cliff:
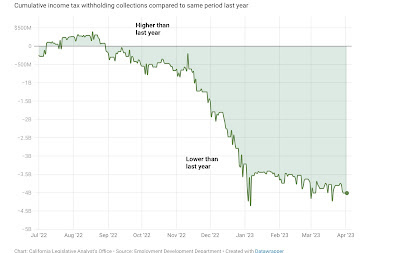
The Department of Revenue looked into the sudden falloff, and determined that the most likely reason was a huge shortfall in the vesting of stock options. As they explained:
“ Some private sector employers pay employees bonus salary at different times of the year. Some bonuses reflect the overall business climate—notably holiday and year-end bonuses—while other bonuses are based on productivity. Productivity bonuses are often paid more frequently, typically at the end of each month or quarter. So far this fiscal year, income tax withholding during the last few days of each month, when bonuses are typically withheld, is far below 2021 levels. Specifically, the figure below shows that withholding during the final week of each month is 12 percent lower this year, despite withholding from the first three weeks of each month being higher in 2022. This dynamic reflects growing employment overall but a potentially sharp drop-off in month-end bonuses.”
It’s reasonable to suggest that California’s experience was not unique. And if the failure of stock options to vest caused a big shortfall in income tax withholding in the 4th quarter of last year, that would be very much in accord with the QCEW experience, and the poor YoY nationwide income tax withholding results late last year.
And that is in exact accordance with the income distributional chart supplied by the Census Bureau as to median earning income, shown above.
The final persuasive evidence comes from the below graph, in which I show the YoY% changes in average hourly earnings, aggregate nonsupervisory payrolls, nominal median household income, and inflation for the past 10 years:
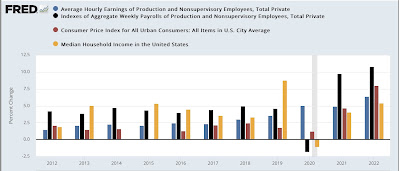
Note the significant divergence of household income from jobs and payrolls in 2013 and 2014, and the large divergence in 2019. None of those years featured any huge economic upturn or downturn. But they *did* feature changes in tax law. The former featured the ending of the 2% withholding tax holiday, causing an increase in withholding in 2014 vs. 2013. The latter featured the taking effect of the pro-Billionaire tax law of 2018, but which also included a near doubling of the standard tax deduction and a slight decrease in many tax brackets.
In other words, significant changes in earnings income have on multiple occasions are Ibsen from either tax law changes and/or the behavior of financial markets.
One final caveat: nevertheless, the big increase in gas prices in early 2022 certainly did not help. As shown in the below graph of median real hourly wages, after the initial pandemic distortions higher (because mainly lower wage workers got laid off), after service workers were largely hired back, real hourly wages declined through mid-2022 before gradually rising back to trend:
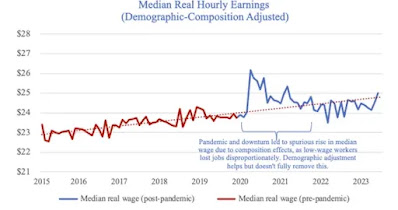
Because aggregate payrolls rose so strongly, this probably was not enough without the additional downturn in the cashing in of stock options to translate into an actual decline in real median household earnings in 2022, but it certainly didn’t help.
Conclusion
The big decline in real median household income in 2022 was hardly a failure of “Bidenomics.” If anything, it reflected the success of Congressional stimulus payments under both the last year of Trump’s presidency, as well as the first year of Biden’s, in keeping the nation from a deeper downturn during the worst of the pandemic.
Further, the stock market decline of 2022 – which was largely responsible for the failure of stock options to vest – was more than anything else about the Fed’s aggressive rate hike policy, which was widely anticipated, and further widely anticipated to cause a recession, not because of any fiscal policies by Congress or the Administration.
The real, timely “real median household income” just stood up: Sentier Research, Angry Bear, New Deal democrat.
