I was looking for a report through 2022 on housing. This was the best I could do. Maybe later? The report is about households with or without SS beneficiaries who are renting, homeowners with mortgages, and homeowners without mortgages. The study is looking at the cost impact in each category for those households with SS beneficiaries as compared to those households with no beneficiaries. Kind of dry; but, it gets the point across. Research Summary: Housing Expenditures, ssa.gov, Source: “Housing Expenditures of Social Security Beneficiaries, 2005–2018,” Patrick Purcell Introduction: Housing is the largest single expenditure category for U.S. households. On average, in 2018, expenditures for housing were equal to 25.5 percent of household
Topics:
Angry Bear considers the following as important: Housing Expenditure's, social security, US EConomics
This could be interesting, too:
NewDealdemocrat writes JOLTS revisions from Yesterday’s Report
Bill Haskell writes The North American Automobile Industry Waits for Trump and the Gov. to Act
Bill Haskell writes Families Struggle Paying for Child Care While Working
Joel Eissenberg writes Time for Senate Dems to stand up against Trump/Musk
I was looking for a report through 2022 on housing. This was the best I could do. Maybe later? The report is about households with or without SS beneficiaries who are renting, homeowners with mortgages, and homeowners without mortgages. The study is looking at the cost impact in each category for those households with SS beneficiaries as compared to those households with no beneficiaries. Kind of dry; but, it gets the point across.
Research Summary: Housing Expenditures, ssa.gov, Source: “Housing Expenditures of Social Security Beneficiaries, 2005–2018,” Patrick Purcell
Introduction:
Housing is the largest single expenditure category for U.S. households. On average, in 2018, expenditures for housing were equal to 25.5 percent of household income among all U.S. households; among those with householders aged 65 or older, housing expenditures were equal to 32.8 percent of household income (Bureau of Labor Statistics 2020).1 Although spending for health care may receive more attention in the media, housing expenditures typically are more than twice the amount of out-of-pocket spending for health care among households headed by individuals aged 65 or older (Johnson 2015).
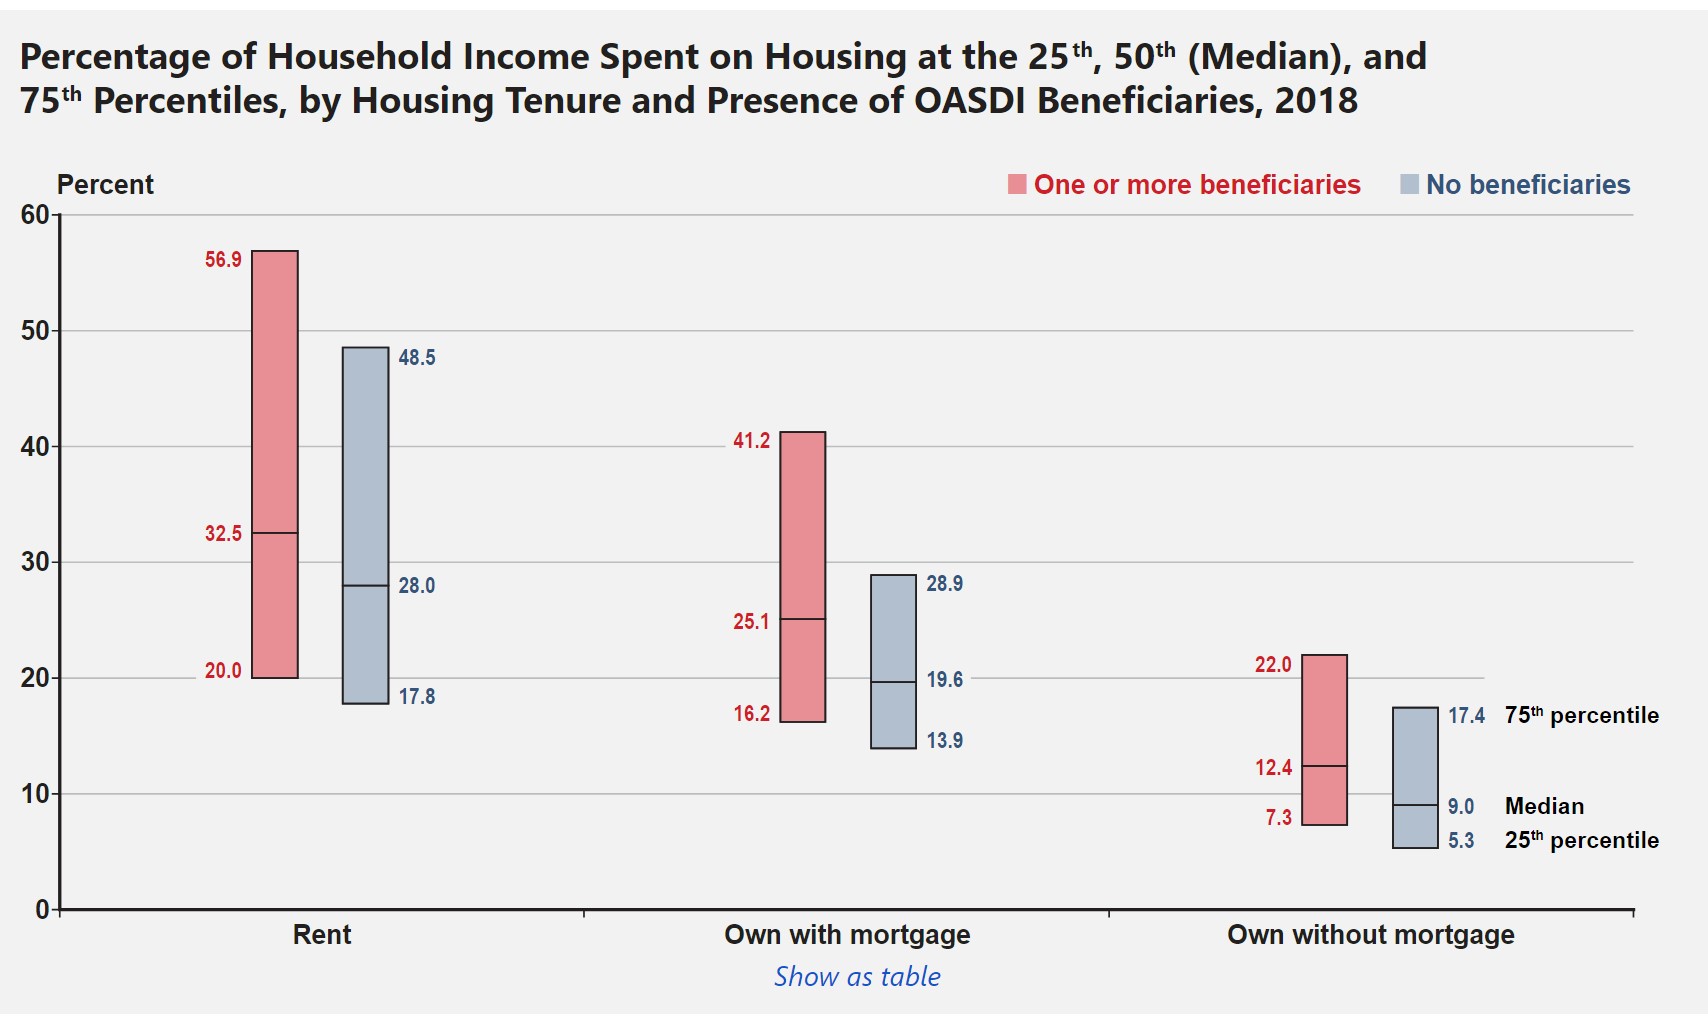
The median percentage of income spent on housing was highest in renter households and lowest in households that owned without a mortgage, regardless of whether the household had a Social Security beneficiary or not.
The median share of income spent on housing by renter households with one or more Social Security beneficiaries was 32.5 percent, while non-beneficiary households spent 28.0 percent. For homeowner households without a mortgage, the median share of income spent was 12.4 percent for beneficiary households and 9.0 percent for non-beneficiary households.
Households that included at least one Social Security beneficiary spent a larger share of income on housing than households with no beneficiaries, regardless of whether it was a renter household or a homeowner household with or without a mortgage.
The median share of income spent on housing by homeowner households with a mortgage was 25.1 percent for beneficiary households and 19.6 percent for non-beneficiary households.
~~~~~~~~
Definition: Beneficiary Household: A household beneficiary refers to a household that receives some form of assistance or support, typically in the context of development projects or poverty reduction initiatives. The benefits received by the households can vary, ranging from economic interventions and improved access to resources, such as food and infrastructure, to social support and capacity-building programs.
~~~~~~~~
In 2018, of the 121.5 million U.S. households 1, 36.0 percent were renters, 39.6 percent were homeowners with a mortgage and 24.4 percent were homeowners without a mortgage.
Greater Detail:
“Housing Expenditures of Social Security Beneficiaries, 2005–2018” documents trends in housing tenure, household income, and the proportion of income spent on housing expenses in selected years from 2005 to 2018, as reported in the ACS. During that period, the number of households in which at least one person received income from Social Security increased from 30.1 million to 38.3 million (27.3 percent), and the proportion of U.S. households with one or more Social Security beneficiaries rose from 26.2 percent to 31.5 percent. In 2018, 24.1 percent of the 38.3 million households in which at least one person received Social Security benefits were renter households, 31.8 percent were homeowners with mortgages, and 44.1 percent were homeowners without mortgages.
In both 2005 and 2018, the median income of homeowner households was higher than that of renter households, and the median income of households with mortgages was higher than that of homeowner households without mortgages. From 2005 to 2018, the real median income of renter households in which at least one person received Social Security benefits increased from $21,730 to $24,400 (12.3 percent). The real median income of beneficiary households with mortgages increased from $61,461 to $66,000 (7.4 percent), and the real median income of nonmortgage-holding homeowner households with beneficiaries increased from $39,217 to $46,200 (17.8 percent).
Expenditures for housing consume a substantial proportion of household income, especially among renter households and mortgage-holding homeowner households. In renter households with one or more Social Security beneficiaries, the median share of income spent on housing was 31.7 percent in 2005 and 32.5 percent in 2018.
One-fourth of renter beneficiary households spent 56.9 percent or more of income on housing in 2018. For mortgage-holding households with one or more Social Security beneficiaries, the median share of income spent on housing was 27.3 percent in 2005 and 25.1 percent in 2018.
In 2018, one-fourth of mortgage-holding beneficiary households spent at least 41.2 percent of income on housing. The median proportion of income spent on housing by nonmortgage-holding homeowner households with one or more Social Security beneficiaries declined from 13.9 percent in 2005 to 12.4 percent in 2018; however, one-fourth of nonmortgage-holding beneficiary households spent at least 22.0 percent of income on housing in 2018.
- Unsourced – In 2018: of the 121.5 million U.S. households, 36.0 percent were renters, 39.6 percent were homeowners with a mortgage and 24.4 percent were homeowners without a mortgage.