– by New Deal democrat “it should be no surprise that Biden’s poll numbers have recently improved.” No big economic news today, so let me update a correlation with information from last Friday’s personal income data. To wit, is consumer sentiment about the economy tied to any real metric? With a lot of noise, it does appear to be correlated. The University of Michigan has been measuring consumer sentiment for over half a century. The last 45 years are available on FRED. The below graph compares this with real disposable personal income per capita. Basically, what we are looking for is, if people have more (or less) money to spend on things other than necessities, is their feeling about the economy better (or worse)? Both data sets, but
Topics:
NewDealdemocrat considers the following as important: consumer sentiment, US EConomics
This could be interesting, too:
NewDealdemocrat writes JOLTS revisions from Yesterday’s Report
Bill Haskell writes The North American Automobile Industry Waits for Trump and the Gov. to Act
Bill Haskell writes Families Struggle Paying for Child Care While Working
Joel Eissenberg writes Time for Senate Dems to stand up against Trump/Musk
– by New Deal democrat
“it should be no surprise that Biden’s poll numbers have recently improved.”
No big economic news today, so let me update a correlation with information from last Friday’s personal income data. To wit, is consumer sentiment about the economy tied to any real metric? With a lot of noise, it does appear to be correlated.
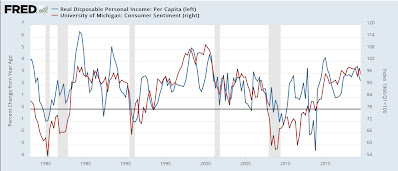
The University of Michigan has been measuring consumer sentiment for over half a century. The last 45 years are available on FRED. The below graph compares this with real disposable personal income per capita. Basically, what we are looking for is, if people have more (or less) money to spend on things other than necessities, is their feeling about the economy better (or worse)?
Both data sets, but especially consumer sentiment, are very noisy on a monthly basis, so the below graph averages both over a quarter:
While there is certainly not a 1 to 1 relationship, and the YoY% change in real disposable income can vary widely with tax law changes, but over the longer term it is pretty clear that both move in the same direction, and more or less at the same turning points.
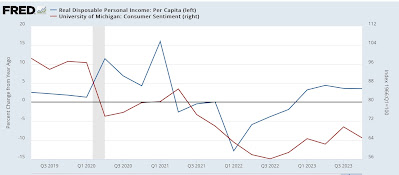
Now here is the same information zoomed in over the past 5 years through the end of the 4th quarter of last year:
Again, far from a 1 to 1 relationship, but (aside from the stimulus quarters) both have moved generally in the same direction at the same time.
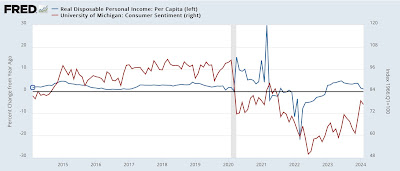
Finally, let’s take the last 10 years and show the same data monthly:
I wanted to include this last graph for two reasons. First, it does show the increasing partisanship of consumer sentiment, with a notable tick up right after Trump’s election at the end of 2016, and with the exception of the 2021 stimulus months, a huge decline after Biden took office in 2021. Second, it picks up the substantial increase in the last two months. Under the circumstances, it should be no surprise that Biden’s poll numbers have recently improved.
“Are you better off than you were four years ago?” Angry Bear by New Deal democrat


