I chose three graphs off of the USA Facts Org. site to make points of where are immigrants coming from, the makeup of them, how the border apprehends them, and the numbers turned away or apprehended. There is a much longer, well detailed, and interesting version of this commentary at USA Facts Org. ~~~~~~~~ 2024 Current State of the Union: US Immigration by USA Facts Org. Some Summary Data Authorized immigration to the US rebounded in FY 2022 after declining almost 50% in FY 2020. Excluding tourism and unauthorized arrivals, most people arriving in the US are temporary workers, students, or coming to be with their families. Federal immigration and border security spending rose in FY 2023 after two consecutive years of decline
Topics:
Bill Haskell considers the following as important: immigration, politics, US/Global Economics
This could be interesting, too:
Robert Skidelsky writes Lord Skidelsky to ask His Majesty’s Government what is their policy with regard to the Ukraine war following the new policy of the government of the United States of America.
Joel Eissenberg writes No Invading Allies Act
Ken Melvin writes A Developed Taste
Bill Haskell writes The North American Automobile Industry Waits for Trump and the Gov. to Act
I chose three graphs off of the USA Facts Org. site to make points of where are immigrants coming from, the makeup of them, how the border apprehends them, and the numbers turned away or apprehended. There is a much longer, well detailed, and interesting version of this commentary at USA Facts Org.
~~~~~~~~
2024 Current State of the Union: US Immigration
by USA Facts Org.
Some Summary Data
- Authorized immigration to the US rebounded in FY 2022 after declining almost 50% in FY 2020.
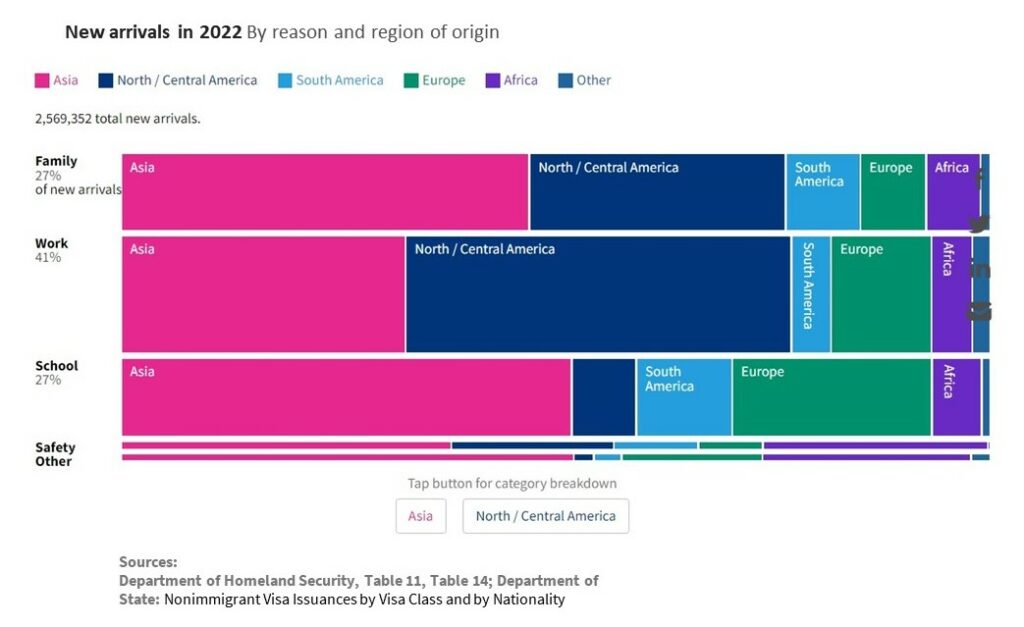
- Excluding tourism and unauthorized arrivals, most people arriving in the US are temporary workers, students, or coming to be with their families.
- Federal immigration and border security spending rose in FY 2023 after two consecutive years of decline following a FY 2020 high.
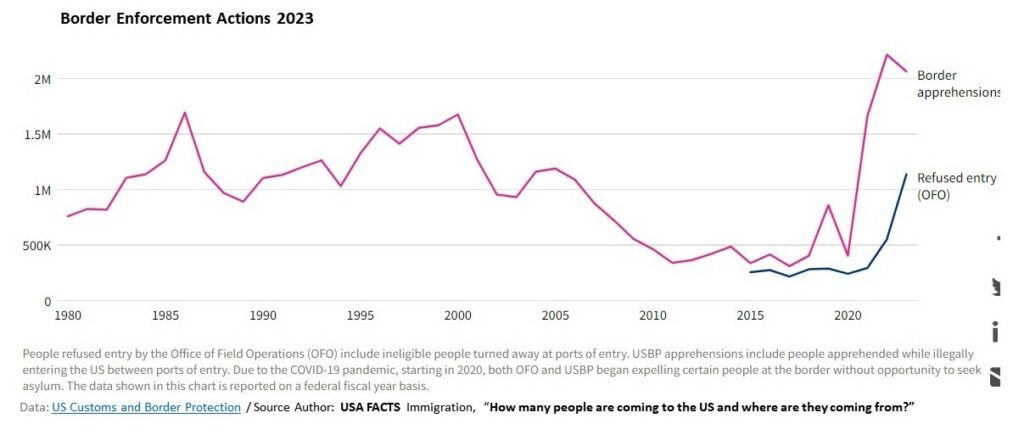
- The number of immigrants turned away or apprehended at US borders reached 3.2 million in FY 2023, the most since at least 1980.
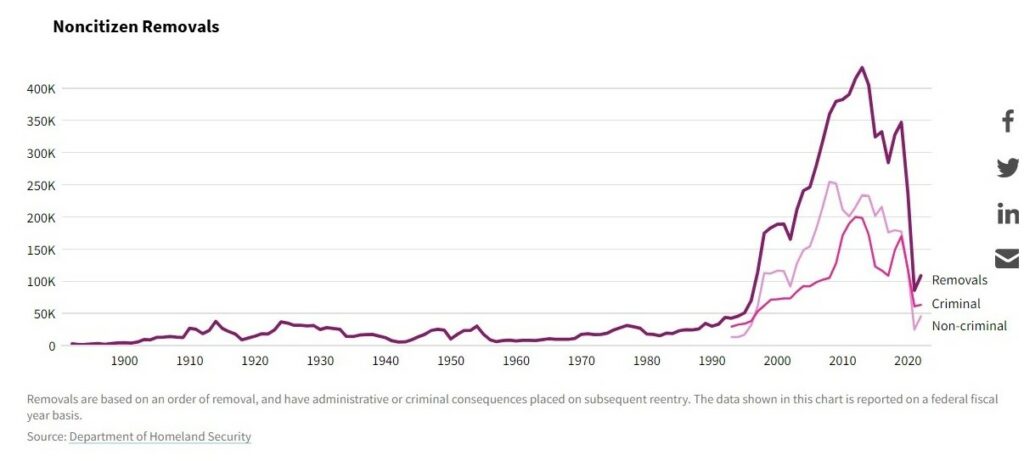
- Immigration officials removed nearly 109,000 people from the US in FY 2022, the most recent year where data is available. This is the fewest removals since 1996, except for 2021.
- In 2022, there were about 46.2 million foreign-born people in the US, an increase from 44.7 million in 2018. The federal government estimated 11.4 million unauthorized immigrants were in the country in 2018.
- About 13.9% of people in the US were foreign-born in 2022.
- Immigrants are more likely to be in the labor force and a married-couple family than people born in the US.
2024 Current State of the Union: US Immigration (usafacts.org)
Excluding tourism and unauthorized arrivals, most people arriving in the US are temporary workers, students, or coming to be with their families.
In FY 2022, Mexicans were the largest share of immigrants coming for work (39%), while Indians were the largest share coming to be with family (24%). India were also the highest percentage of people coming for school (18%).
2024 Current State of the Union: US Immigration (usafacts.org)
The number of immigrants turned away or apprehended at US borders reached 3.2 million in FY 2023, the most since at least 1980.
More than 2 million immigrants were apprehended illegally entering the US. The remaining 1.1 million were turned away at legal ports of entry by of the Office of Field Operations — more than double the number in FY 2022.


