Money from Sick People Part IV: Paying a Premium for Drug Pricing Irregularity — 46brooklyn Research Starting with the Q1 2023 Drug Pricing file (all of this information was knowable before the 2024 Medicare plan bid process was completed). Within the files are the five insulin products we identified as taking large price decreases. 46 Brooklyn identifies each of the specific drug products (i.e. dosage form and strength) at the NDC-level, the minimum reported Medicare Part D plan unit price, the maximum reported plan unit price, and the total number of unique prices reported for that drug across all Medicare plans in Q1 2023. The effort to interpret these Medicare files is daunting, the beauty of the analysis is the author talking about brand
Topics:
Bill Haskell considers the following as important: 46Brooklyn, analysis, Healthcare, Pharmaceuticals, US/Global Economics
This could be interesting, too:
Bill Haskell writes Families Struggle Paying for Child Care While Working
Joel Eissenberg writes How Tesla makes money
Joel Eissenberg writes RFK Jr. blames the victims
Angry Bear writes True pricing: effects on competition
Money from Sick People Part IV: Paying a Premium for Drug Pricing Irregularity — 46brooklyn Research
Starting with the Q1 2023 Drug Pricing file (all of this information was knowable before the 2024 Medicare plan bid process was completed). Within the files are the five insulin products we identified as taking large price decreases. 46 Brooklyn identifies each of the specific drug products (i.e. dosage form and strength) at the NDC-level, the minimum reported Medicare Part D plan unit price, the maximum reported plan unit price, and the total number of unique prices reported for that drug across all Medicare plans in Q1 2023.
The effort to interpret these Medicare files is daunting, the beauty of the analysis is the author talking about brand drugs where there will not have NDC variability. In this case we do not worry about the perceptions of manufacturer list price for generics which can be influenced by the specific labeler selected amongst the various interchangeable NDCs. From there, we limited prices based upon the 30-day reported unit price for the purposes of consistency across the various products and plans (not all plans had a 90-day unit price. The 30-day aligns with the most common experience). In the table below we identify by product basis our observation of insulin prices in Q1 2023 based upon the number of unique prices observed, the minimum observed unit price and the maximum observed unit price.
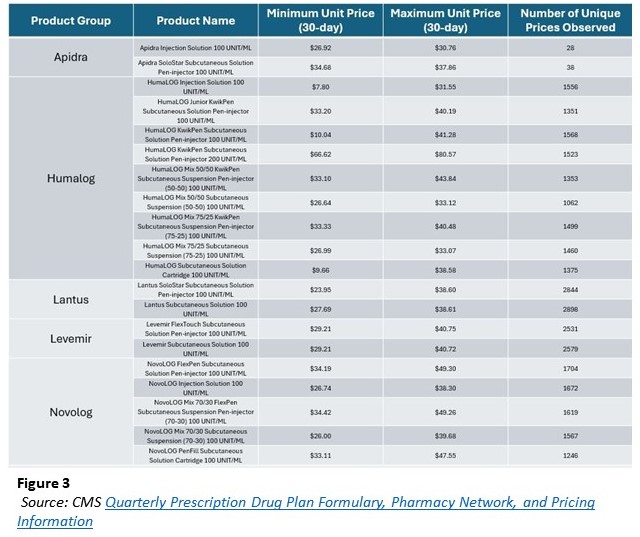
As can be seen above, insulin drug prices in 2023 were highly variable and more variable than the drug manufacturer list price might allow. Reviewing the first row as an example, there was just one WAC unit price for Apidra Injection Solution 100 unit/mL, as set by the manufacturer Sanofi. Yet Medicare plans took the one price experience and reported 28 different prices across a range of experiences ($26.92 to $30.76; $3.84 per unit delta; maximum price 14% higher than minimum). Apidra Injection Solution 100 unit/mL was a stand-out. Not because it represented a one-off occurrence, but rather because it represented one of the low-end ranges for number of unique prices and min-to-max price range deltas within Medicare. Looking at another Sanofi product, having just one manufacturer list price. Lantus is one of the most utilized insulin products in the country having thousands of unique prices of which the high price of the SoloStar pen being 61% more than the low-end price.
In the end, the five insulin products represent 20 unique, individual drugs (based upon the idea a unique, drug represents the active ingredient, dosage form, and strength actually prescribed). An attempt to draw conclusions from a table of 20 products is challenging, but let’s start at a high level and then look at an individual drug example.
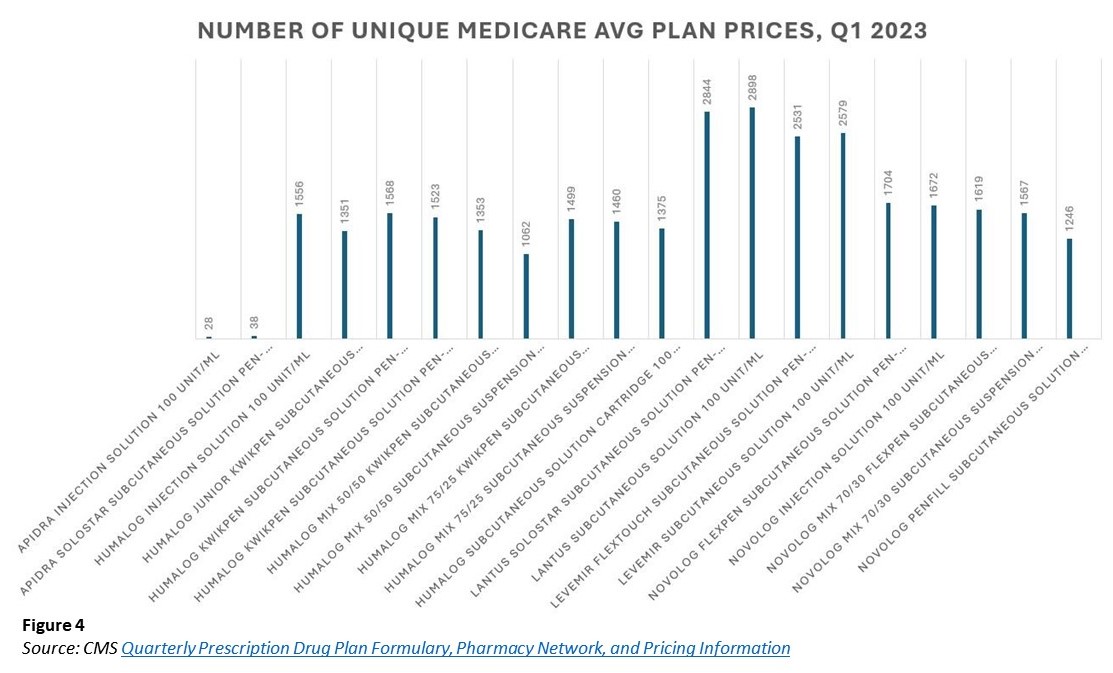
Each product represents just one brand product line (i.e., Apidra, Humalog, Lantus, Levemir, and Novolog), with one brand manufacturer-set list price (i.e., only one list price for Lantus 100 unit/mL vial –$292 in 2023), the approximate 5,000+ different Medicare plans were setting highly variable prices for the drug (more than 2,000 unique Lantus 100 unit/mL vial prices). The figure below simply graphs the total number of unique prices for each product observed in 2023.
While variability in drug pricing may make even the nastiest rollercoaster envious, it may not be directly significant to Medicare beneficiaries at the point-of-sale (earlier mentioned $35 cap on insulin for Medicare beneficiaries). It arguably is impactful in the aggregate. Recall not everyone in America gets access to low-cost sharing amounts at the pharmacy counter (i.e., $35 insulin cap).
In order to access lower than list prices for drugs, you must enroll with a Medicare prescription drug plan and pay the monthly premium. If you are subject to a $35 cap on insulin, then sometimes the premium paid to get access to the cap via your insurance in the first place, represented more or less value. Considering the Lantus 100 unit/mL figure above, the $35 copay cap on insulin represents roughly 12% of the total low-end Lantus price (based upon 1 package size of 10 mL; $276.89) or 9% of the total high-end price ($386.06).
As drug prices influence monthly prescription drug insurance premium amounts, this variability is important to note. The more high-end prices prevail, the higher the premium will need to be in the future to cover the underlying expenses. That can be problematic for seniors regardless of whether they are protected from experiencing the cost at the pharmacy counter or not. Said differently, in some ways, the plan price (although unknown to the patient at the pharmacy counter) can be just as important to the patient experience as the copay when viewed from a system perspective. A low-cost sharing amount from the patient requiring a large premium to secure may not be all much of success in the end.
Examining historic trends some more, we can see there was a range of low-to-high price experiences historically. The narrowest band in 2023 (based upon the Q1 file) was for Apidra SoloStar Subcutaneous Solution Pen-injector 100 unit/ml. It differed by 9% from low to high ($34.68 to $37.86 per unit; $3.18 delta). Apidra is the least utilized of all these insulin products within Medicare (just $6 million out of the aforementioned $11 billion figure in annual Medicare insulin spending).
The largest pricing range was for HumaLOG KwikPen Subcutaneous Solution Pen-injector 100 unit/mL. There was a four-fold difference from low to high ($10.04 to $41.28 per unit; $31.24 delta). In some ways, if we really think about it, the high delta is to be expected (how else could so many unique prices be created unless there was a large range); however, it also shows how the value of the prescription insurance we purchase is largely a matter of perception. If we focus only on our cost sharing at the pharmacy counter, we miss how that cost sharing figure was recognized to begin with (i.e., the premium paid to secure it).
The average Medicare Part D premium (2024) is ~$50 per month ($43 to $55.50 depending upon how you handle the calculation of the average). The amount of premium to be paid by an enrollee of a particular Medicare plan is arrived at via a regulated process by Medicare seeking bids from potential contractors on the cost to provide prescription drug benefits. A better understanding of the bid process works is not necessary for today’s exercise. We need to understand that it costs roughly $50 per month to enjoy the benefits of lower drug costs at the pharmacy counter with Medicare insurance such as the $35 cap on insulin prices. If we cannot pay the premium, we cannot get the cap.
However, if the premium becomes out of reach because it is arrived at by factoring in underlying plan highly variable drug costs subject to which plans members actually select regardless of the manufacturer list price — then what protection to drug pricing are we really buying (even with an insulin copay cap?).
To explore, let us leave the past (Q1 2023) and examine insulin prices in Medicare in 2024. Recall this is after each of the above-mentioned insulin products took list price decreases of approximately 70%. What we see in Figure 5 below is that a 70% decrease does not make insulin prices any less variable (in fact — the low to high price ranges are even more variable than before). Nor does a 70% list price decrease universally translate into a 70% lower plan price (why should it when plan prices were not universally related to list prices in 2023?).
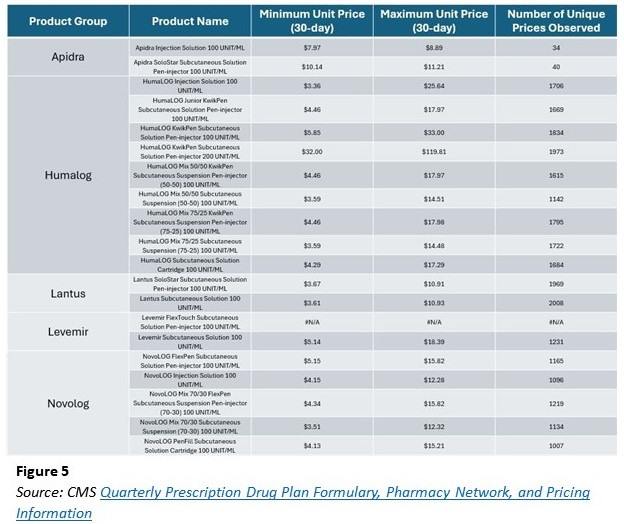
While not immediately clear, arguably the Medicare Part D plan drug pricing experience is more variable in 2024 than it was in 2023 (the published price goes out to four decimal points, so not all identified unique prices may be significantly unique [at penny-level significance], but interesting nonetheless). In Figure 6 below, we compare the dollar range of price from high-to-low on a per-product basis across both the 2023 and 2024 Medicare experience.
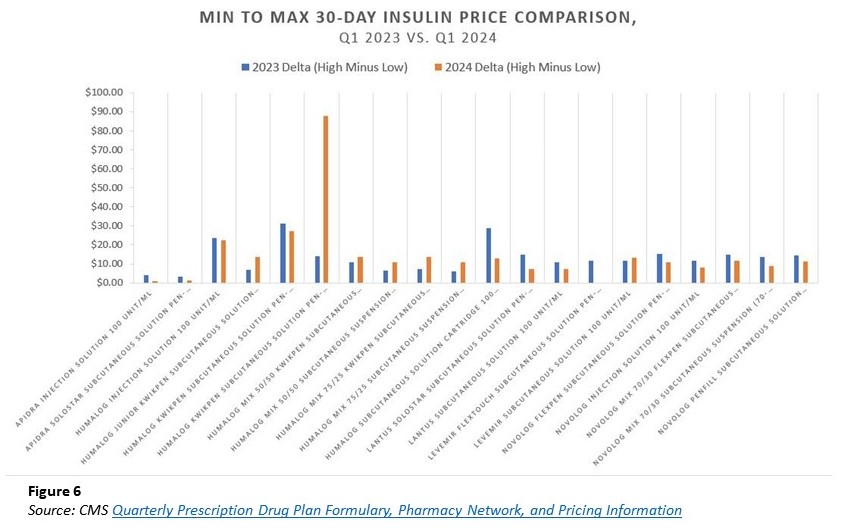
With few exceptions, most drugs have a smaller dollar range in 2024 than in 2023. However, it is not universally true. Our first signal that something may be a little out of whack with the belief of manufacturer price = drug price (or at least manufacturer price = plan price). While the above can be a little difficult to read, we provide the below Figure 7 that selects just one representative version of each of the five insulin products (the vials, which did not necessarily have the most significant ranges from the above chart but are consistent with what examples we’ve used historically).
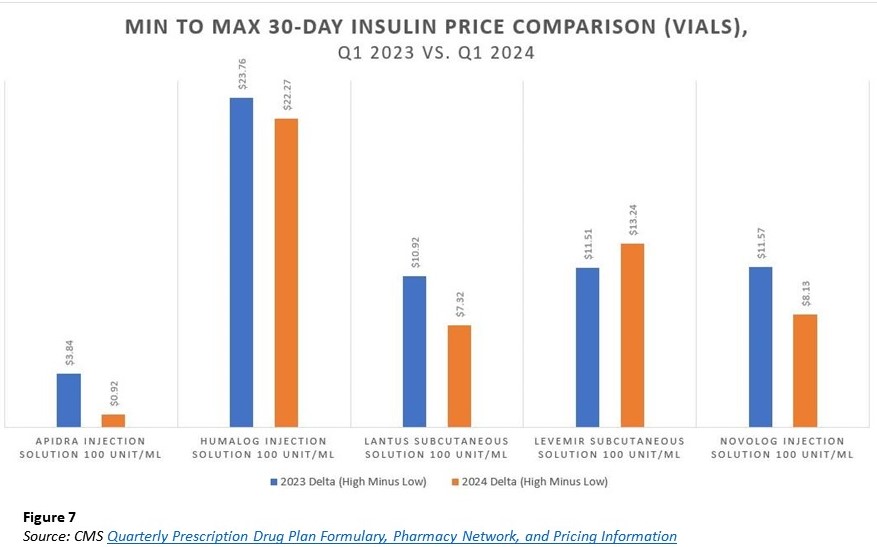
Again, Figure 7 shows us that while most variance were smaller (on a dollar basis) from 2023 to 2024, it was not universally the case. While pricing differences are obviously of different raw dollar significance, they are also significant as a proportion of the drugs “price. “
For example, Lantus vials in 2023 had a price range of almost $11 per unit from low-to-high in 2023 ($27.69 to $38.61) compared to $7 per unit in 2024 ($3.61 to $10.93). While the $11 range is a bigger dollar difference than the 2024 $7 amount, the scale of difference in 2024 is arguably more, as the $7 delta represents a higher multiplier from low-to-high experience. Specifically, the $11 per unit price delta for Lantus in 2023 was ~39% of the minimum reported 2023 price. Whereas the $7 delta in 2024 is 202% of the underlying minimum reported 2024 price. If we all want access to the low drug price, a 200-fold difference from high to low doesn’t sound very appealing (at least to those at the top).
At the same time, other drugs, such as Apidra, were less variable from 2023 to 2024. To try and get a better assessment of the data (given the various prices across the five different insulins and their different price decreases), we attempt to re-contextualize the figures above based upon the percentage differences minimum-to-maximum as a proportion of the underlying minimum price for each year in Figure 8 below. Said differently, we’re attempting to present the information above in a manner that scales each the same regardless of the individual dollar price differences.
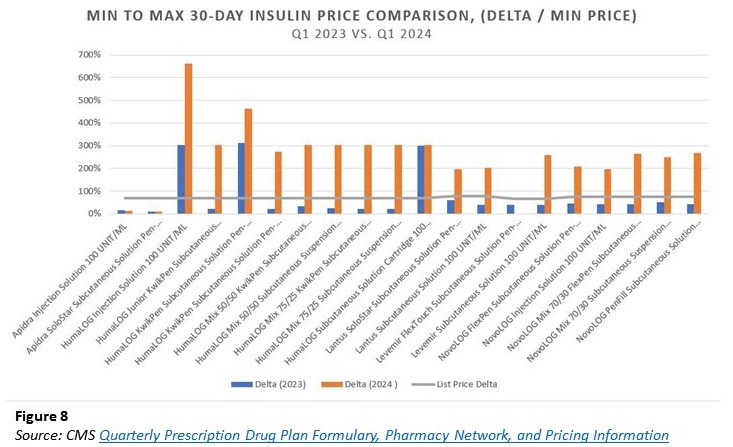
Again, we pull out just the vials to make the interpretation of the above Figure 8 a little easier:
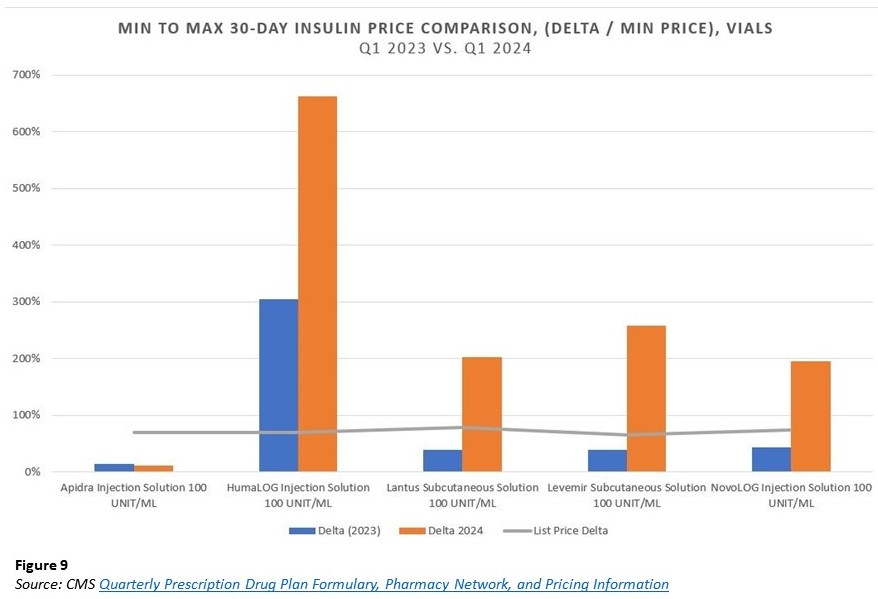
You may believe Figure 9 is not a fair characterization of the comparison? And (sorry for starting with “and”) we should compare the deltas from low-to-low and high-to-high to the list price decrease to observe whether the drug manufacturer price decreases resulted in equivalent better Medicare pricing? In Figure 10 and the following charts, a comparison of such (all drugs and then just the vials; but don’t miss that there is a product whose top end price is 2024 is higher than even the top end 2023 price despite the product taking a 70% price decrease) is made.
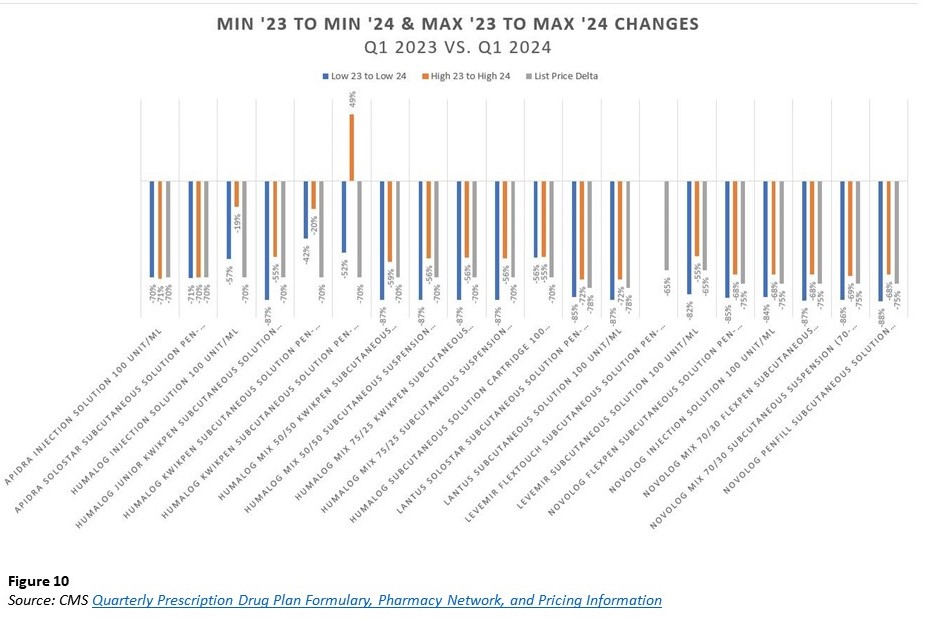
Figure 11: Comparison of Vials alone.
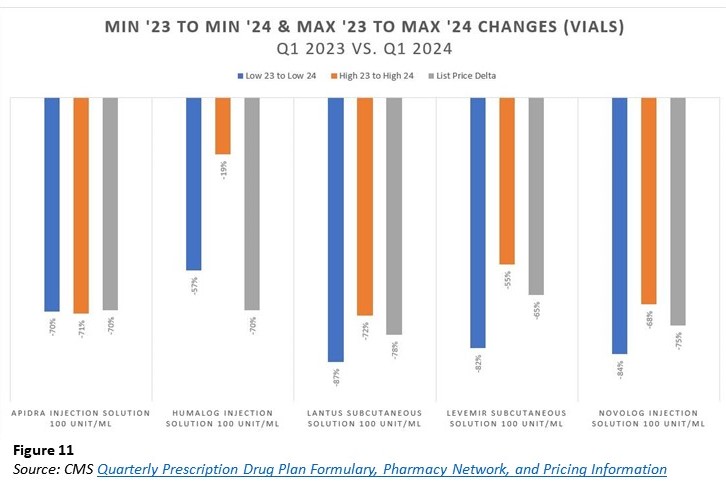
It should not be lost for at least one insulin product, the maximum observed price in Medicare plans is higher in 2024 than it was in 2023 (despite that product being associated with a 70% manufacturer price decrease). Digging a little deeper, we asked the data to compare these 2024 maximum Medicare plan prices against the underlying WAC unit price, and imagine our surprise when universally, the highest possible Medicare unit price was actually higher than the underlying WAC unit price. While we don’t have the latitude to publish the specific WACs (per our data license agreement), we can give a sense for the degree of “variance above WAC (Figure 12).” Just know, the range of price variability was 2% to 286% above WAC for the collection of individual drugs these five insulin products represent. (Note: that because the experience is so variable high to low, a $ sign in Figure 12 below does not represent the same step up each time).
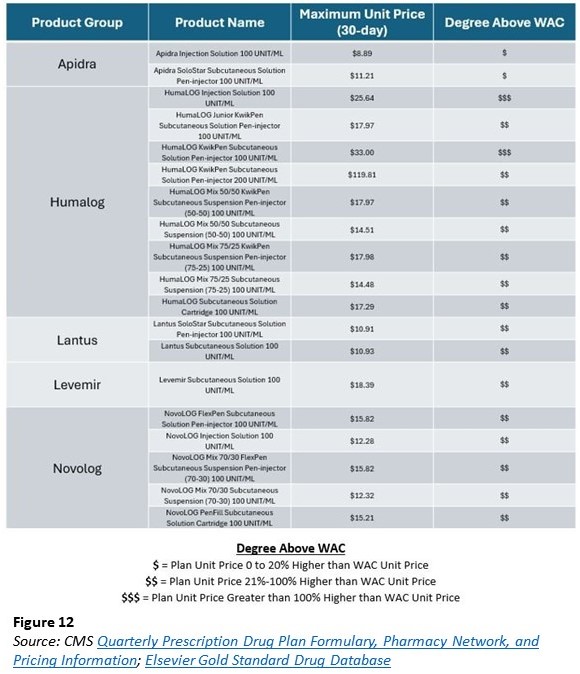
Figure 12 is an encapsulation of what we raised at the start of this report. Overly simplistic views on drug pricing should be rejected, as they are not founded in the facts. To hear some say with regard to insulin no less,:
“Drug manufacturers alone set and raise drug prices, and PBMs are holding drug companies accountable by negotiating the lowest possible cost for drugs, including insulins, on behalf of patients.“
These are clearly statements not founded in the reality of the data. To be clear, 46brooklyn’s analysis of the Medicare drug pricing today has focused on the extremes of both high and low. If we look at the most common prices (whether average or median), we “would” find that prices are at or below manufacturer list prices for these products. However, how can such variability on price possibly represent the “lowest possible cost” when there are so many prices higher than what is clearly identified as the minimum?
Said differently, how can a multiple to the fake and artificially inflated list price possibly represent the “lowest possible cost?”
Whether it is a function of the historic pricing disparity or a broader reflection of the irrational manner with which drug prices are arrived at within the Medicare program, it should be noted there is still a significant range of experience in insulin prices despite the drug price decreases. Of which none could be universally identified to have a direct 1-to-1 relationship between the manufacturer list price decrease and the end Medicare price experience for the drug product. We interpret the above to represent that despite both,
1) protecting patients from bloated, disparate drug prices through cost sharing caps (i.e., $35 per month max); and
2) drug manufacturer list prices decreasing (70%+ WAC decreases), the end result was a lack of a universal experience for insulin product pricing for Medicare plans.
Said differently, the price of insulin is not a direct function of the manufacturer list price, the insulin copay, and/or the combination of both.
Insuring the irrational drug pricing world or some conclusions
If you have not connected the dots between irrational drug prices and money from sick people, perhaps our final attempt will help. Imagine you have been recently hired to develop the premium rate to be paid for health insurance. Whether you’re aware of it or not, actuaries craft premium rate structures through meticulous analysis of projected claims and administrative expenses.
Factors that are considered include claim costs (which in turn reflect provider prices, utilization, and enrollee demographics and health status); administrative costs; and some combination of risk charge, contribution to surplus, and profit. How would you develop an estimated premium in the face of a thousand different prices for one insulin product (to say nothing of how such compounds across the half dozen or so insulin products which may be used [not all insulin products took a price decrease])?
We previously stated that when there are a dozen different prices, there are effectively no prices. Transparency in pricing is not a cure-all for the dysfunction of drug pricing; rather, it equips those with the knowledge and means to enact positive changes (see the American Academy of Actuaries statements re: price transparency).
Matt Stoller just wrote an enlightening piece on drug pricing and pharmacy benefits, which we highly encourage you to read (with particular attention given to the discussion on price discrimination). If your job was on the line to develop the rate we were going to pay (i.e., premium) to get our protection money (i.e., low cost sharing) against the irrational world of drug pricing, are you going to err on the side of setting a higher or lower rate?
In our Money from Sick People series to date, the focus has been about how sick patients front big out-of-pocket costs that yield discounts that aren’t being used to offset their inflated experience at the pharmacy counter. Thanks to policy changes, Medicare no longer subjects diabetic patients to these perverse forms of cost-shifting. However, just because the problem of distorted, inflated drug prices is shifted away from the point-of-sale, it doesn’t mean that the problem has been vanquished. When an intermediary has the ability to create hundreds of different prices for the same medicine from low to high, from a certain point of view, anything that surpasses the low point is an added cost.
Ultimately, the bill of drug pricing dysfunction comes due regardless of where in the spectrum it is experienced. In other words, we can create a world where the copay of insulin is capped, but one way or another, the full balance will be paid. So until something materially alters the architecture our system of inflated, disparate prices, expect Money from Sick People to live on.