An Updating of Medicaid disenrollments in the nation. Clicking on this tab – state data will take you to individual state numeric. Some states attack the issue of disenrollment with a relish even when the federal government is picking up most of the tab to enroll them. In the end, they will still show up at a hospital to be treated. Andrew Sprung and I exchanged a few comments the other day. My suggestion was to enroll people automatically into the ACA when they are 200% or less in income. Some hospitals are doing such as the insurance is no cost to those who are 200% or less. Anyway here are the death-star states which are kicking people off of Medicaid. Also click on the charts to enlarge to make them more readable. Medicaid Enrollment and
Topics:
Bill Haskell considers the following as important: Healthcare, Medicaid
This could be interesting, too:
Bill Haskell writes Families Struggle Paying for Child Care While Working
Joel Eissenberg writes RFK Jr. blames the victims
Joel Eissenberg writes The branding of Medicaid
Bill Haskell writes Why Healthcare Costs So Much . . .
An Updating of Medicaid disenrollments in the nation. Clicking on this tab – state data will take you to individual state numeric. Some states attack the issue of disenrollment with a relish even when the federal government is picking up most of the tab to enroll them. In the end, they will still show up at a hospital to be treated.
Andrew Sprung and I exchanged a few comments the other day. My suggestion was to enroll people automatically into the ACA when they are 200% or less in income. Some hospitals are doing such as the insurance is no cost to those who are 200% or less. Anyway here are the death-star states which are kicking people off of Medicaid. Also click on the charts to enlarge to make them more readable.
Medicaid Enrollment and Unwinding Tracker, Overview at KFF, Dec 20, 2023
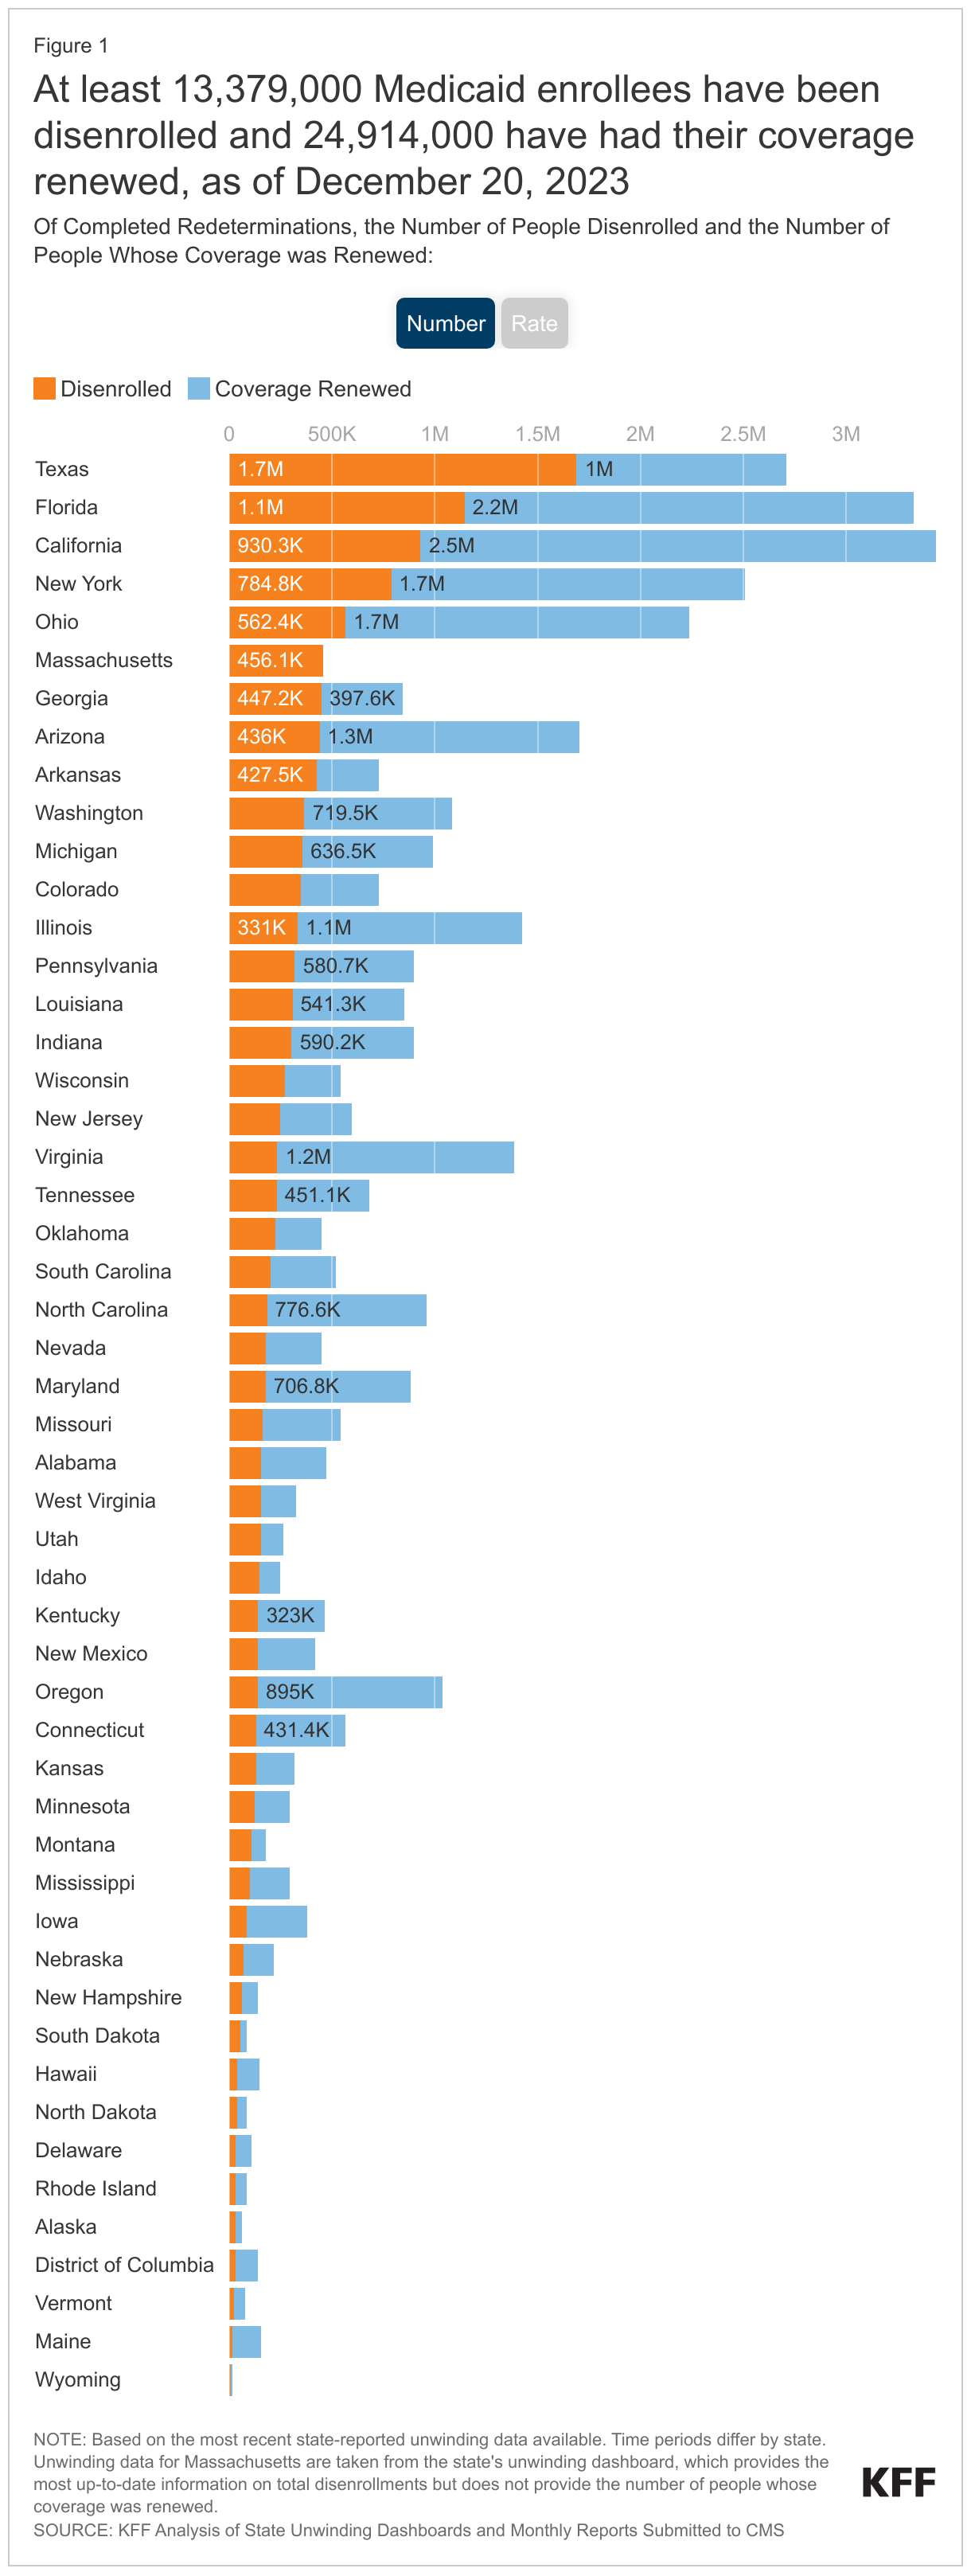
Medicaid Disenrollments
- An approximate 13,379,000 Medicaid enrollees have been disenrolled as of December 20, 2023. This based on the most current data from all 50 states and the District of Columbia. Overall, 34% of people with a completed renewal were disenrolled in reporting states while 66%, or 23.9 million enrollees, had their coverage renewed (one reporting state does not include data on renewed enrollees). Due to varying lags for when states report data, the data reported here undercount the actual number of disenrollments to date.
- A wide variation in disenrollment rates exists across reporting states, ranging from 62% in Texas to 10% in Maine. Differences in who states are targeting with early renewals as well as differences in renewal policies and system capacity likely explains some of the variation in disenrollment rates. Some states (such as Texas and South Carolina) are initially targeting people early in the unwinding period they think are no longer eligible or who did not respond to renewal requests during the pandemic. Other states are conducting renewals based on an individual’s renewal date. Additionally, some states have adopted several policies promoting continued coverage among those who remain eligible and have automated eligibility systems that easily and accurately process renewals. Other states have adopted fewer of these policies and have more manually-driven systems.
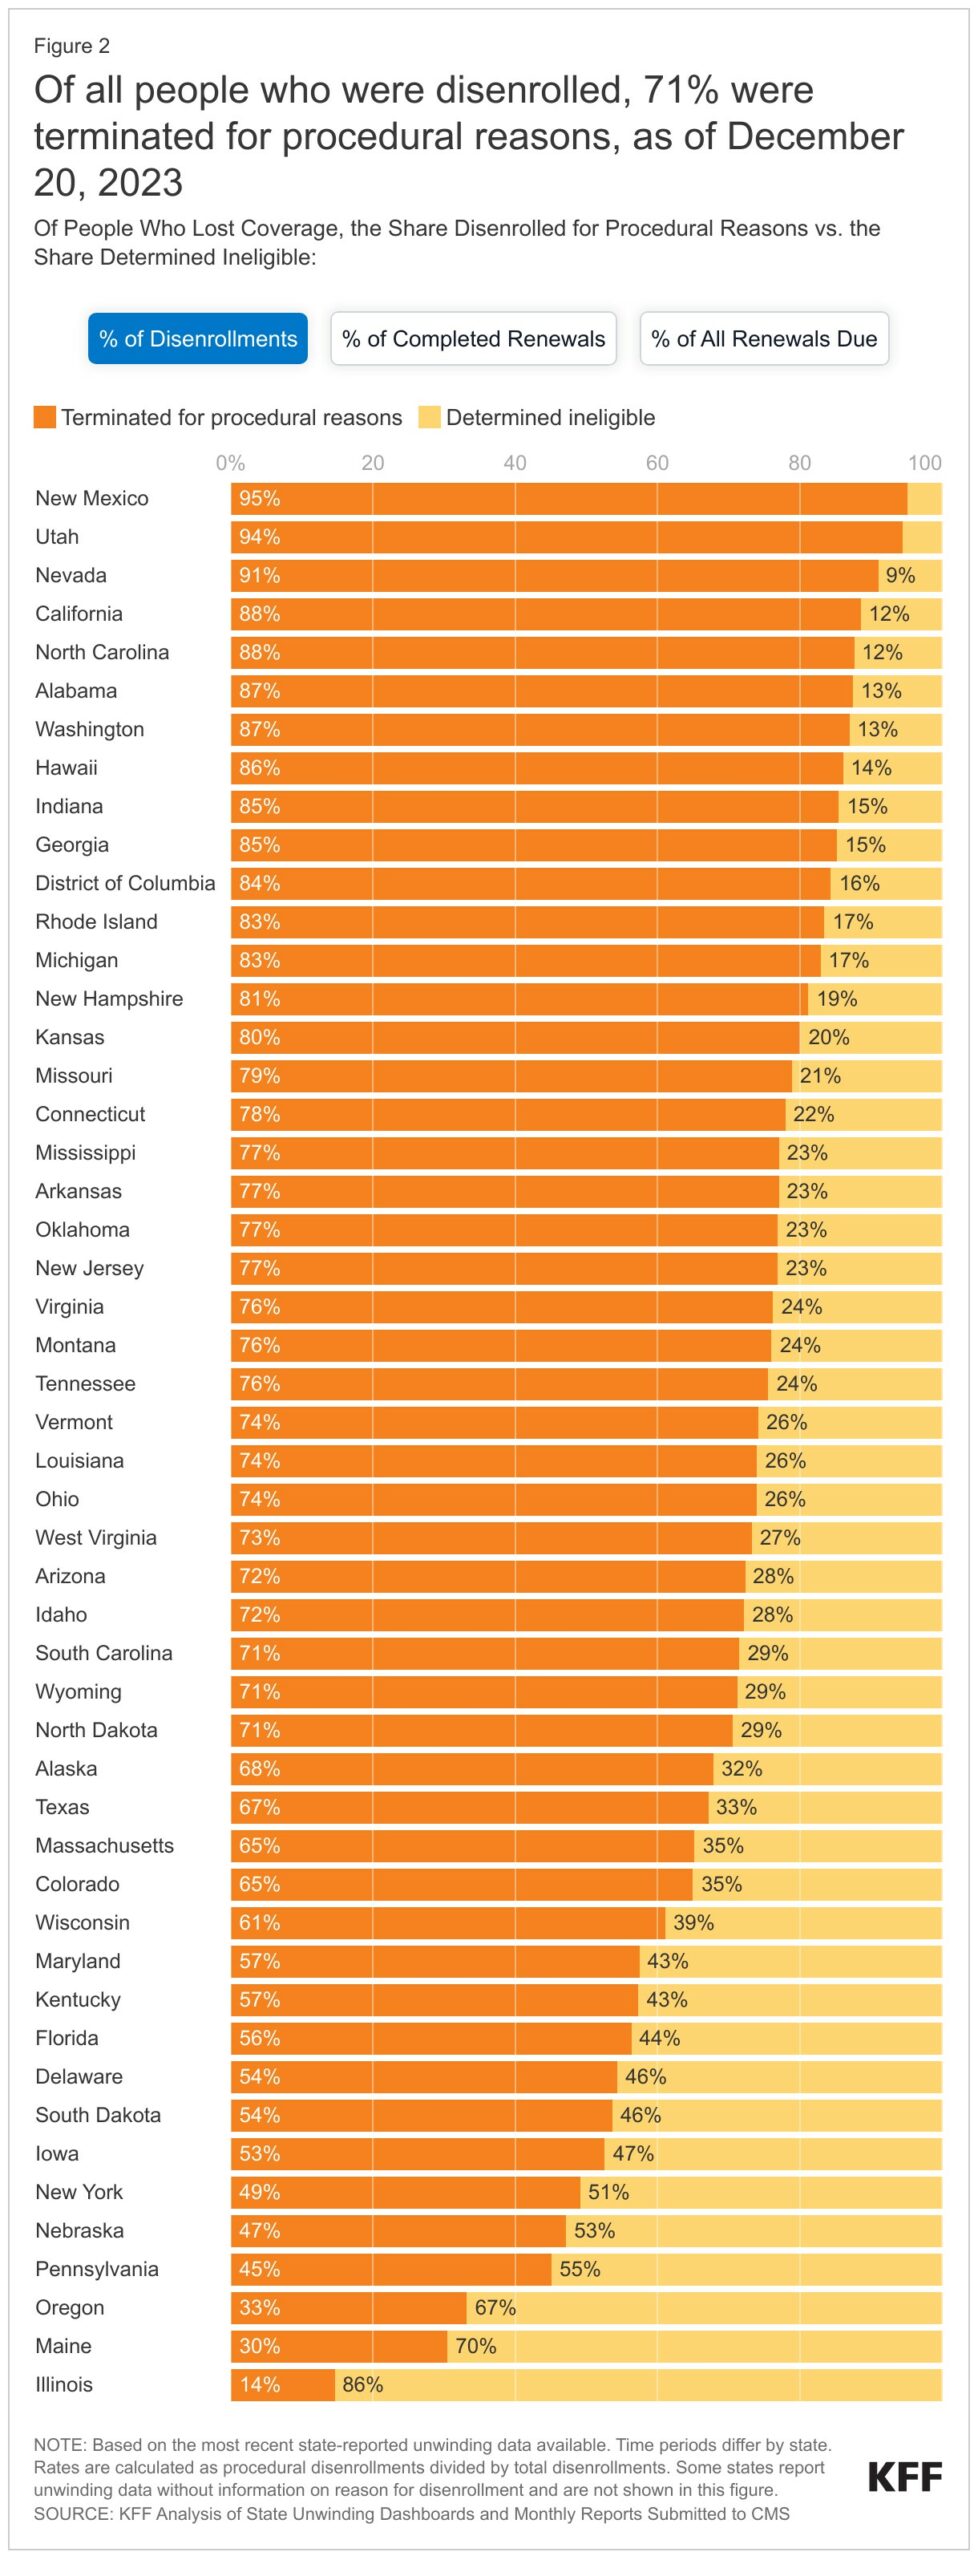
- Across all states with available data, 71% of all people disenrolled had their coverage terminated for procedural reasons. These rates vary based on how they are calculated (see note below). Procedural disenrollments are cases where people are disenrolled because they did not complete the renewal process. It can occur when the state has outdated contact information, because the enrollee does not understand, or otherwise does not complete renewal packets within a specific timeframe. High procedural disenrollment rates are concerning because many people who are disenrolled for these paperwork reasons may still be eligible for Medicaid coverage. Some states have temporarily paused procedural terminations for some enrollees while they address problems in the renewal process that lead to increased procedural disenrollments.
(Note: The first tab in the figure (on the KFF site) below calculates procedural disenrollment rates using total disenrollments as the denominator. The second tab shows these rates using total completed renewals, which include people whose coverage was terminated as well as those whose coverage was renewed, as the denominator. And finally, the third tab calculates the rates as a share of all renewals due, which include completed renewals and pending cases.)
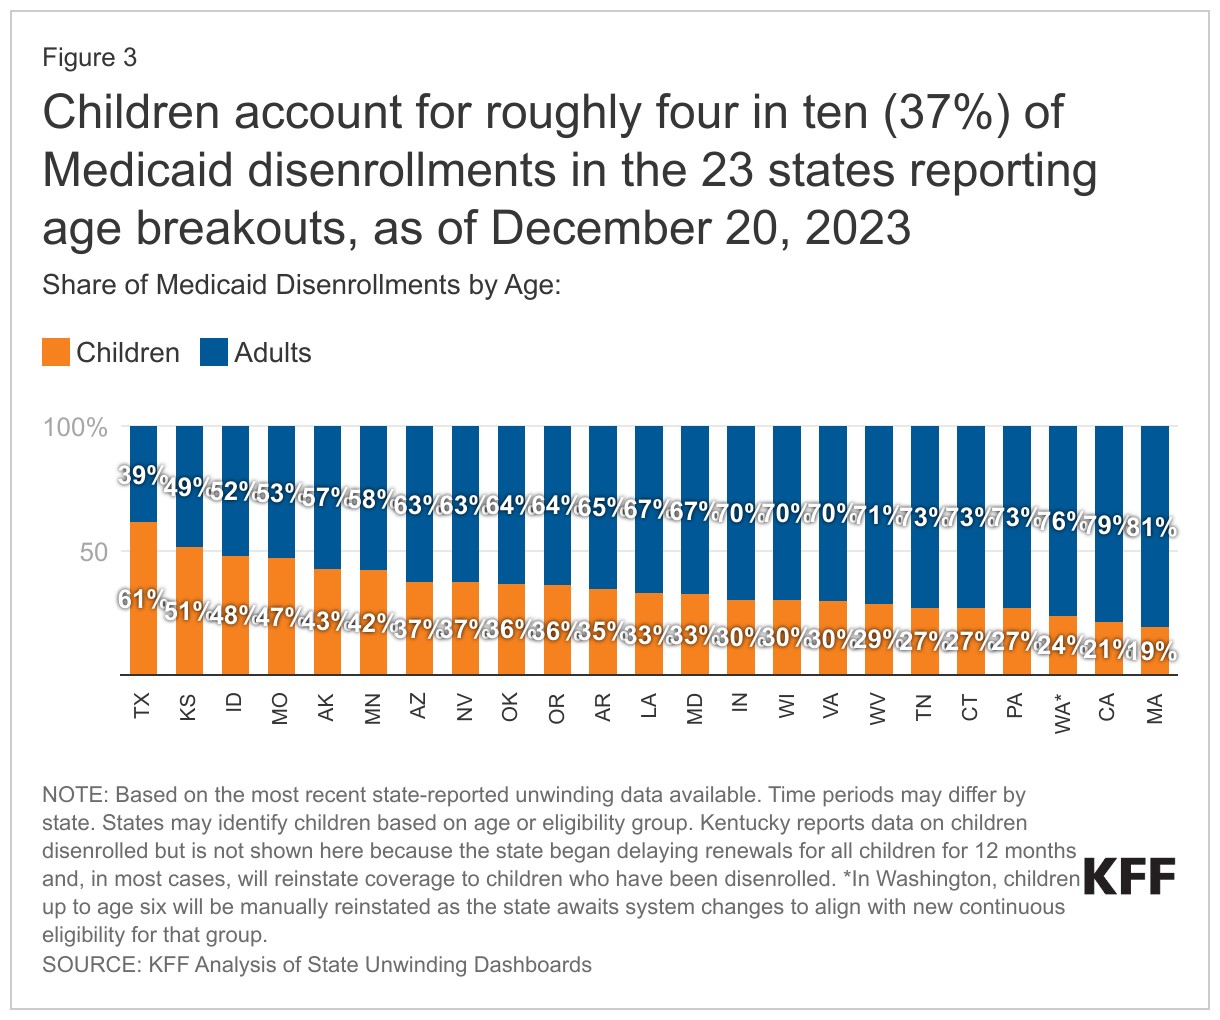
Medicaid Disenrollments of Children
Although data are limited, children accounted for roughly four in ten (37%) Medicaid disenrollments in the 23 states reporting age breakouts. As of December 20, 2023, at least 2,486,000 children had been disenrolled out of 6,756,000 total disenrollments in the 23 states. Because Texas has one of the largest Medicaid programs, and because of the limited number of states reporting, Texas has a disproportionate impact on the share of children disenrolled. The share of children disenrolled ranged from 61% in Texas to 19% in Massachusetts.
There are more charts at KFF detailing renewals, net changes, etc. if you are interested. Clicking on Overview at KFF will take you there.