I have been shrinking this total report through editing so as to make it easier to read in a shorter amount of time. It is also split into three parts to minimize the size of the read also. To me, it is pretty interesting as there have been discussion about how the CBO and other agencies such as Social Security and the Census reach their conclusions. For you, it might be boring. Just attempting to promote better understanding. ~~~~~~~~ The Budget and Economic Outlook: 2024 to 2034 | Congressional Budget Office, February 7, 2024 Process, Procedure, and Findings To Estimate the size of the Labor Force, the CBO uses the civilian noninstitutionalized population. To project that population, CBO also uses the historical ratio of the Social
Topics:
Bill Haskell considers the following as important: cbo projections, immigration, US EConomics
This could be interesting, too:
NewDealdemocrat writes JOLTS revisions from Yesterday’s Report
Bill Haskell writes The North American Automobile Industry Waits for Trump and the Gov. to Act
Bill Haskell writes Families Struggle Paying for Child Care While Working
Joel Eissenberg writes Time for Senate Dems to stand up against Trump/Musk
I have been shrinking this total report through editing so as to make it easier to read in a shorter amount of time. It is also split into three parts to minimize the size of the read also. To me, it is pretty interesting as there have been discussion about how the CBO and other agencies such as Social Security and the Census reach their conclusions. For you, it might be boring. Just attempting to promote better understanding.
~~~~~~~~
The Budget and Economic Outlook: 2024 to 2034 | Congressional Budget Office, February 7, 2024
Process, Procedure, and Findings
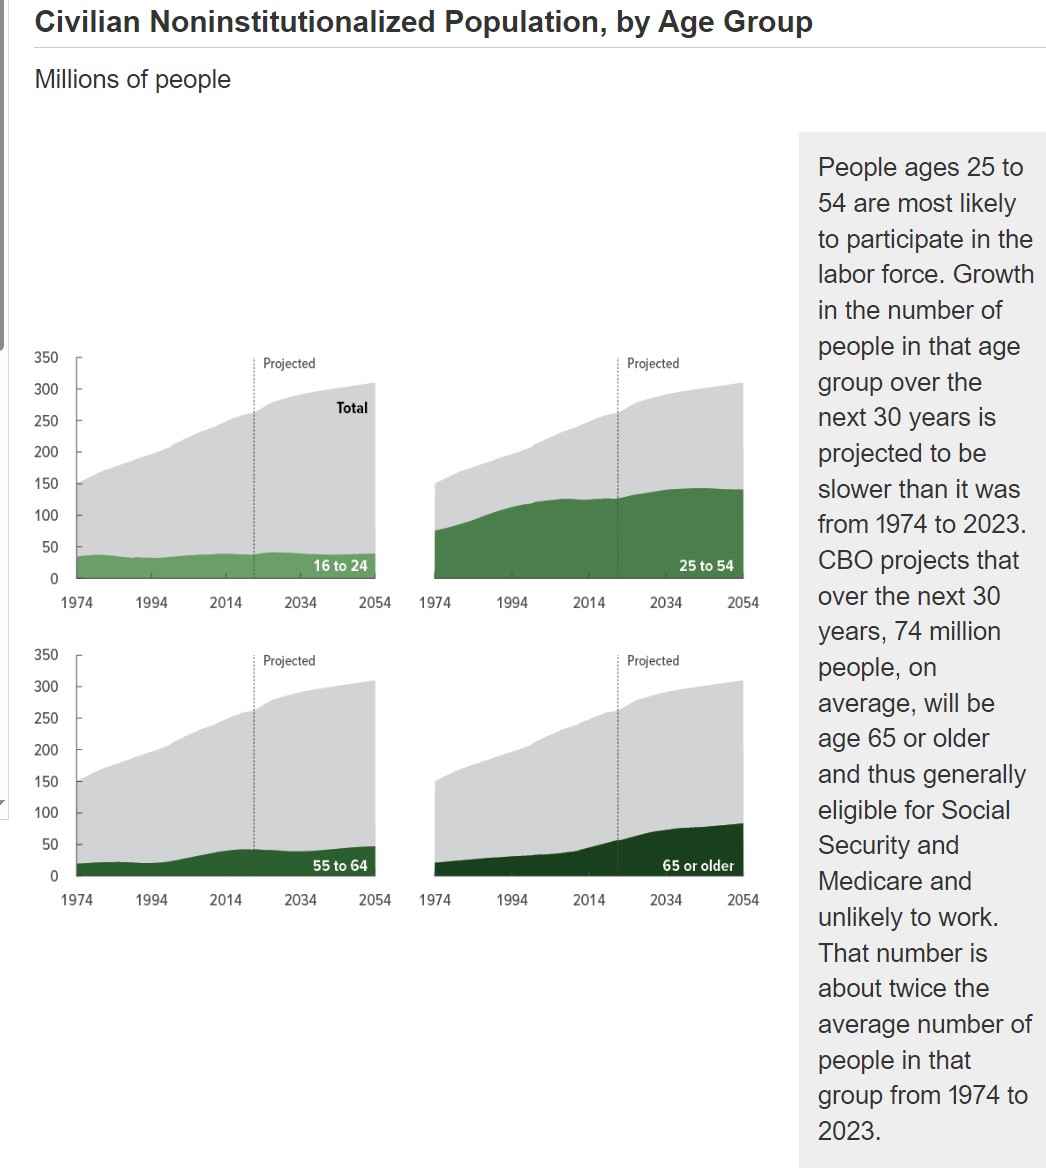
To Estimate the size of the Labor Force, the CBO uses the civilian noninstitutionalized population. To project that population, CBO also uses the historical ratio of the Social Security area population to the civilian noninstitutionalized population, by sex and age group.
In CBO’s projections, the civilian noninstitutionalized population rises from 271 million in 2024 to 310 million in 2054, or at an average rate of 0.4 percent per year. The number of people age 65 or older grows at an average annual rate of 1.1 percent, which is faster than the growth rate for people ages 25 to 54 (0.3 percent per year). The number of people ages 16 to 24 declines slightly, on average, over the projection period.
Uncertainty in CBO’s projections of the civilian noninstitutionalized population stems from uncertainty in the underlying components. If the rates of fertility, mortality, and net immigration diverged from those in CBO’s projections, then measures of the population used to project the labor force would differ as well.
Changes to CBO’s Population Projections Since Last Year
All told, changes to projected rates of fertility, mortality, and, particularly, net immigration mean the CBO now expects the population to be larger and to grow faster on average. Different than the agency projected last year. In this year’s projections, the population in 2053 (the final year covered in last year’s report) is projected to have 8.9 million more people or an increase of 2.4 percent.
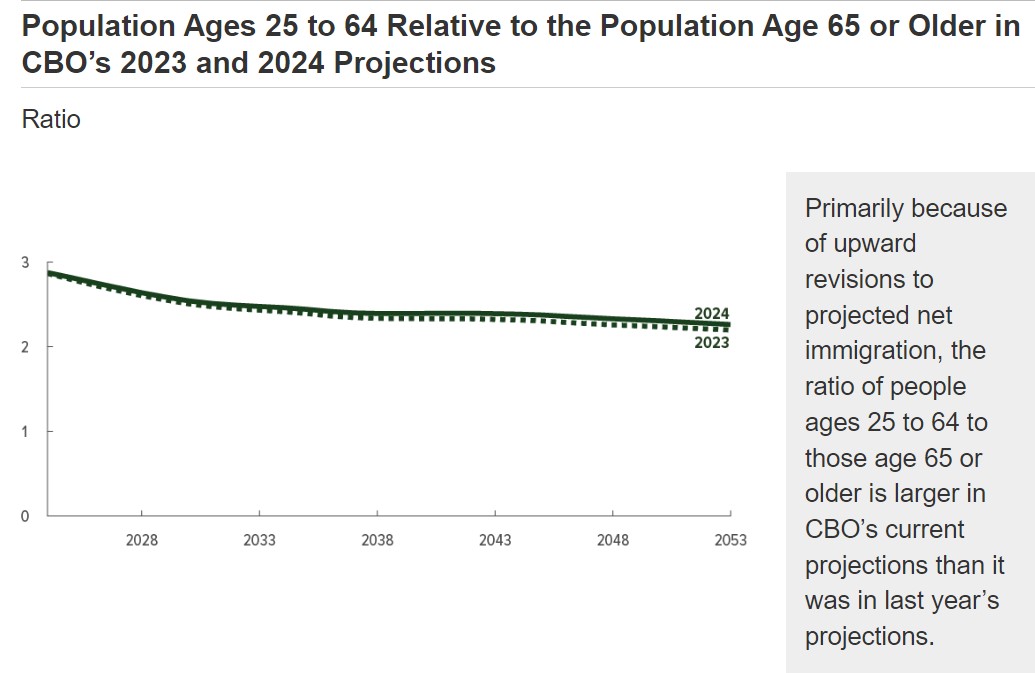
Upward revisions to the size of the population ages 25 to 54 stem from greater projected net immigration which accounts for 57 percent of the overall increase in the annual population estimates from 2024 to 2053. Changes to the number of people age 24 or younger, ages 55 to 64, and age 65 or older account for 25 percent, 9 percent, and 9 percent, respectively, of the overall increase. Those changes are the result of greater projected net immigration, lower projected rates of fertility, and lower projected rates of mortality from COVID-19 than in last year’s projections.

Changes to Projected Fertility Rates
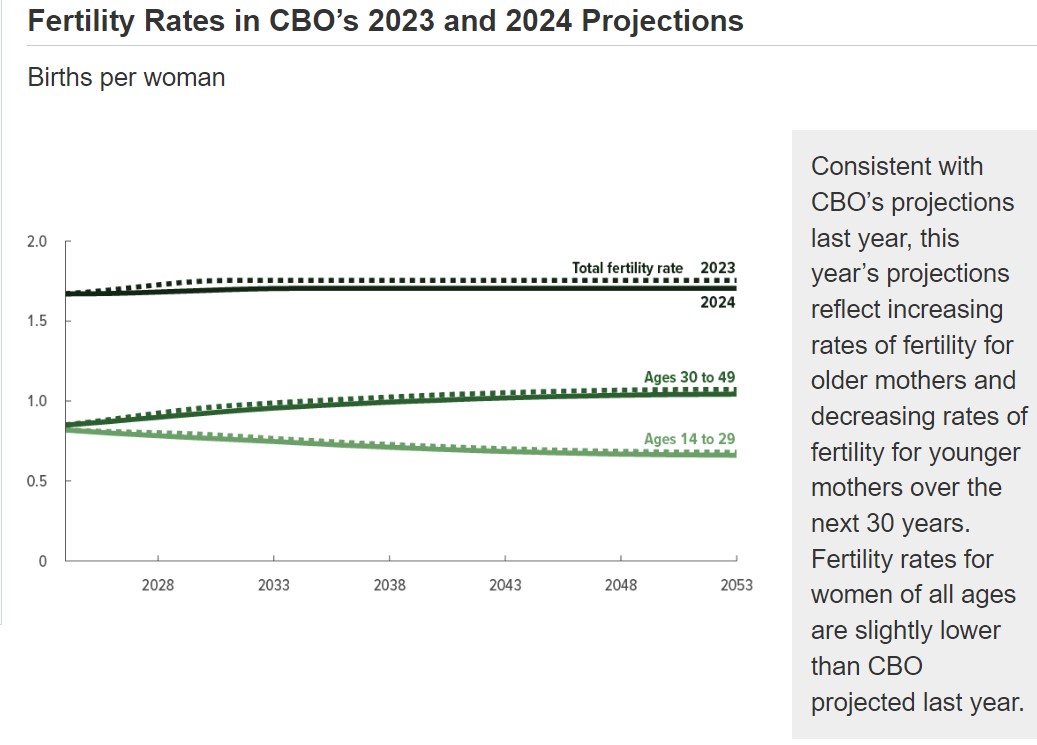
In CBO’s current projections, the total fertility rate reaches 1.70 by 2034. That long-run total fertility rate is lower than the 1.75 births per woman that the agency projected last year and closer to the rate observed in 2022 (the most recent year for which data are available).2 As a result of the change, the total fertility rate from 2024 to 2053 is lower, on average, than the agency projected last year. However, because the population is now larger in most years of the 30-year period than CBO projected last year, the number of births is higher than CBO projected last year in most years. Higher by about 70,000 per year from 2024 to 2034, on average.3 However, by 2048, the number of births is slightly lower than CBO projected last year.
Changes to Projected Mortality Rates
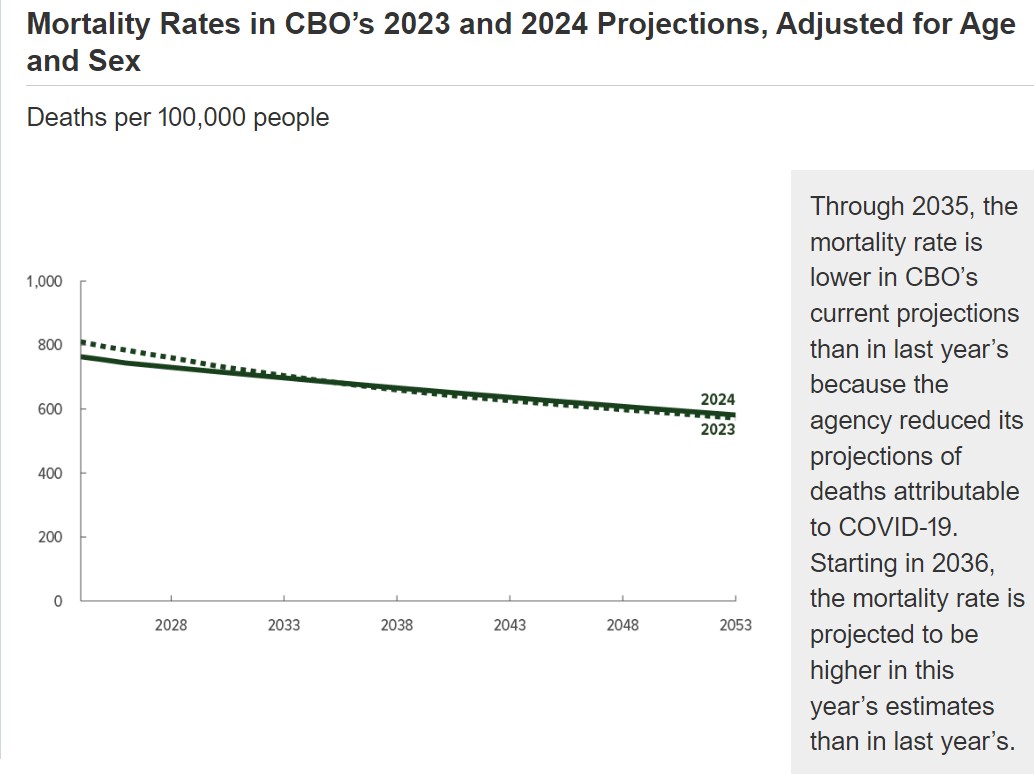
CBO reduced the projected number of deaths attributable to COVID-19. The reduction is based on the latest data available from the Centers for Disease Control and Prevention and an assessment of future trends in mortality due to COVID-19. CBO currently projects 10,000 (or 0.4 percent) fewer deaths per year, on average, from 2024 to 2033 than it did last year. After 2033, mortality rates generally return to previously projected levels, but, beginning in 2036, those rates are slightly higher than CBO projected last year because some of the deaths that previously occurred in the near term are now projected to occur in later years. Largely because the population is bigger in this year’s projections than it was in last year’s, the number of deaths is now projected to be larger by 100,000 (or 2.6 percent) per year, on average, from 2034 to 2053.
Life expectancies at birth and at age 65 are projected to average 79.3 years and 20.0 years, respectively, from 2024 to 2033. Those projections are slightly higher than the agency’s estimates last year (79.0 years and 19.7 years). For the third decade of the period (2044 to 2053), average life expectancies at birth and at age 65 are 81.6 years and 21.4 years in CBO’s projections—slightly lower than those estimated last year (81.8 years and 21.5 years, respectively).
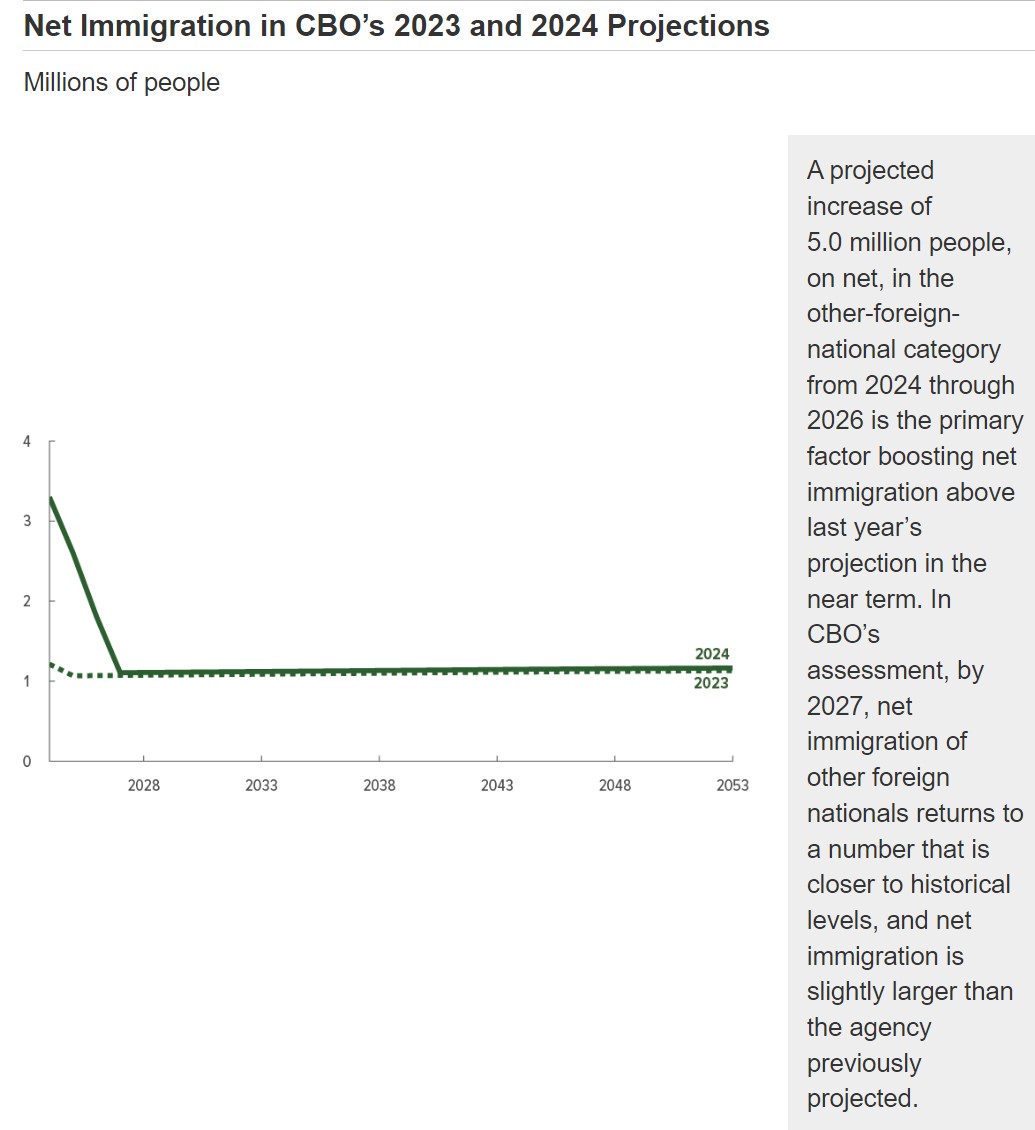
Changes to Projected Net Immigration
In CBO’s current estimates, net immigration is larger than the agency estimated last year, by 0.7 million people in 2021, 1.4 million people in 2022, 1.9 million people in 2023, 2.1 million people in 2024, 1.5 million people in 2025, and 0.7 million people in 2026. Those differences occur primarily because net immigration of people in the other-foreign-national category is projected to be larger than the agency projected last year. In CBO’s assessment, two factors largely account for those increases in its estimates:
- Customs and Border Protection officials are encountering more people attempting to enter the United States and are releasing more of them into the country with humanitarian parole or with a notice to appear before an immigration judge, and
- More people are illegally entering the country without encountering Customs and Border Protection officials.
Data from the Department of Homeland Security indicate that increases in immigration of people in the other-foreign-national category have occurred in recent years as a result of those factors. Additionally, data from the Current Population Survey shows increases in the foreign-born share of the population in 2022 and 2023. This is broadly consistent with the increases in net immigration of other foreign nationals. The data does not provide information about the legal status of people.
Changes Since Last Year in the Population Projections CBO Uses to Estimate the Size of the Labor Force
In CBO’s current projections, the civilian noninstitutionalized population (the measure CBO uses to estimate the size of the labor force) is 2.6 percent larger (equaling 7.9 million more people) in 2053 than the agency projected last year.
From 2024 to 2053, CBO’s projection of the civilian noninstitutionalized population ages 25 to 54 is larger by 4.8 million people (or 3.6 percent) per year. The population ages 16 to 24 is also larger by 1.5 million people (or 4.0 percent) per year, on average, than in the agency’s projections last year. The differences stem from upward revisions to CBO’s projections of net immigration and near-term reductions to mortality rates, which are partially offset by reductions to projected fertility rates. Those rates of immigration, fertility, and mortality underlie CBO’s projection of the Social Security area population, which is used to construct the agency’s projection of the civilian noninstitutionalized population.
The agency’s projections of the civilian noninstitutionalized population ages 55 to 64 and age 65 or older are slightly higher than last year, by an average of 740,000 people (or 1.8 percent) and 270,000 people (or 0.4 percent) per year, respectively. Those differences mainly result from lower projected rates of mortality attributable to COVID-19 and changes to the agency’s projections of net immigration.
~~~~~~~~
The Budget and Economic Outlook: 2024 to 2034 | Congressional Budget Office, February 7, 2024
This completes Part II of the three-part series which was estimating the size of the Labor Force. To estimate the size of the labor force, CBO uses the civilian noninstitutionalized population. To project population, CBO uses the historical ratio of the Social Security area population to the civilian noninstitutionalized population, by sex and age group.
Part III will do a comparison of the CBO’s Population Projections with Those of Other Agencies. It will be a few days before I touch that topic.