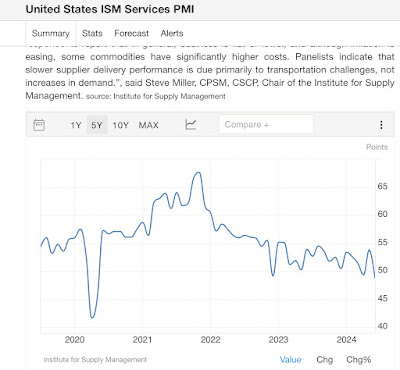
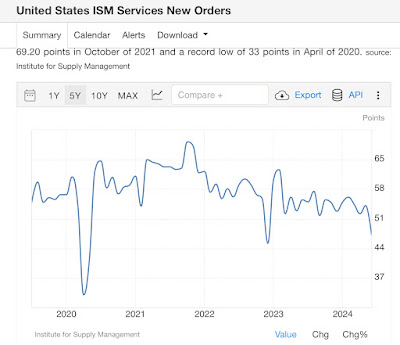
– by New Deal democrat I’ll spare you the introductory graphs this month, but let me reiterate my opening comments from last month: I never used to pay much attention to the ISM non-manufacturing report. That is partly because it only has a 20 year history, and partly because it seems to be more coincident than leading, but because manufacturing has faded so much as a share of the US economy, with at least two false recession signal in the past 10 years (2015-16 and 2022-23), there is no choice but to pay more attention. In particular, it does seem that when we include this as part of a weighted average (75%) along with the ISM manufacturing index (25%), it has generated a much more reliable, and still timely, reading over this Millennium.
Topics:
NewDealdemocrat considers the following as important: ISM non-manufacturing, MFG, US EConomics
This could be interesting, too:
NewDealdemocrat writes JOLTS revisions from Yesterday’s Report
Bill Haskell writes The North American Automobile Industry Waits for Trump and the Gov. to Act
Bill Haskell writes Families Struggle Paying for Child Care While Working
Joel Eissenberg writes Time for Senate Dems to stand up against Trump/Musk
– by New Deal democrat
I’ll spare you the introductory graphs this month, but let me reiterate my opening comments from last month:
I never used to pay much attention to the ISM non-manufacturing report. That is partly because it only has a 20 year history, and partly because it seems to be more coincident than leading, but because manufacturing has faded so much as a share of the US economy, with at least two false recession signal in the past 10 years (2015-16 and 2022-23), there is no choice but to pay more attention.
In particular, it does seem that when we include this as part of a weighted average (75%) along with the ISM manufacturing index (25%), it has generated a much more reliable, and still timely, reading over this Millennium.
On Monday, the ISM manufacturing index, and its more leading new orders component, continued to be negative. In May, the non-manufacturing index this morning completely outweighed that in its strength.
But not today, as the non-manufacturing index and its new orders component both fell below 50 for the first time since December 2022:
Here are the last five months of both the manufacturing (left column) and non-manufacturing index (center) numbers, and their weighted average (right):
JAN 49.1. 53.4. 52.3
FEB 47.8 52.6. 51.4
MAR 50.3. 51.4. 51.1
APR 49.2 49.4. 49.3
MAY 48.9. 53.8. 52.5
JUN 48.5. 48.8. 48.7
And here is the same data for the new orders components:
JAN 52.5. 55.0. 54.4
FEB 49.2 56.1. 54.4
MAR 51.4. 54.4. 53.6
APR 49.1. 52.2. 51.4
MAY 45.4. 54.1. 51.9
JUN. 49.3 47.3. 47.8
This is the second time in three months that the weighted average for the total indexes came in below 50. The more leading new orders index was also below 50 for the first time.
To generate a reliable signal, we would need the 3 month average to be below 50. The weighted average for the total is 50.2. For new orders it is 50.4.
In other words, the signal for the combined weighted ISM indexes remains expansionary – but just barely – in its forecast for the next few months. If it were just a little bit worse, it would be enough, in conjunction with what has been happening with building construction, to hoist a recession watch (note: NOT “warning”!). But it is enough to hoist a yellow caution flag for the economy.
The Bonddad Blog
ISM weighted manufacturing + services indexes signal continued expansion, Angry Bear by New Deal democrat


