– by New Deal democrat Officially reported initial jobless claims declined -17,000 to 233,000 last week. The four-week moving average rose 750 to 240,750. With the typical one-week delay, continuing claims rose 6,000 to 1.875 million, the highest number since November 17, 2021: On the more important YoY basis, initial claims were down -9.7%, while the 4-week average was nigher by 0.3%. Continuing claims were higher by 5.8%, up by more than their recent range but still well below their YoY readings from several months ago and last year: Because this is the first week of August, I’ll dispense with my usual note about the unemployment rate and the “Sahm rule.” Instead, there’s a more important point to discuss: the impact of Hurricane
Topics:
NewDealdemocrat considers the following as important: Hurricane Beryl, politics, US EConomics
This could be interesting, too:
Robert Skidelsky writes Lord Skidelsky to ask His Majesty’s Government what is their policy with regard to the Ukraine war following the new policy of the government of the United States of America.
NewDealdemocrat writes JOLTS revisions from Yesterday’s Report
Joel Eissenberg writes No Invading Allies Act
Ken Melvin writes A Developed Taste
– by New Deal democrat
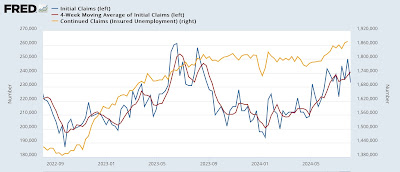
Officially reported initial jobless claims declined -17,000 to 233,000 last week. The four-week moving average rose 750 to 240,750. With the typical one-week delay, continuing claims rose 6,000 to 1.875 million, the highest number since November 17, 2021:
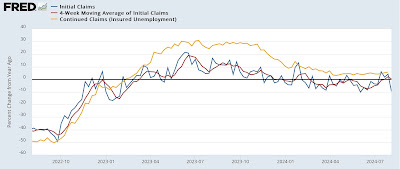
On the more important YoY basis, initial claims were down -9.7%, while the 4-week average was nigher by 0.3%. Continuing claims were higher by 5.8%, up by more than their recent range but still well below their YoY readings from several months ago and last year:
Because this is the first week of August, I’ll dispense with my usual note about the unemployment rate and the “Sahm rule.”
Instead, there’s a more important point to discuss: the impact of Hurricane Beryl, which made landfall in Texas on July 8, on jobless claims in July.
Up until then, my “unresolved seasonality” hypothesis was working very well. But after that, claims were indeed higher YoY.
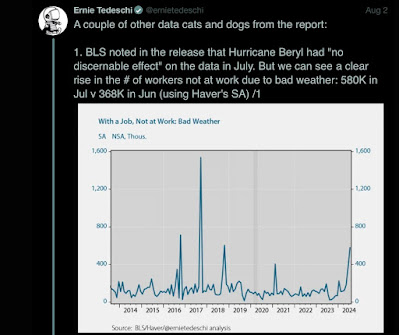
Well, Ernie Tedeschi had a good point last Friday in his discussion of the jobs report. While the BLS downplayed any impact by Hurricane Beryl, it looks like it did play a role in depressing hours worked:
Graph Above: Ernie Tedeschi, BLS noted in the release that Hurricane Beryl had “no discernable effect” on the data in July. But we can see a clear rise in the # of workers not at work due to bad weather: 580K in Jul v 368K in Jun (using Haver’s SA) /1
That got me wondering whether it had also shown up in jobless claims. Because first you employer says we don’t need you this week, because we don’t have power. Then it puts you on temporary layoff.
After Hurricane Sandy a decade ago, and several Nor’easters and wildfires since, I created a workaround by subtracting the State(s) affected by the weather event and looked at jobless claims including all the other States. This data is not seasonally adjusted, so you then have to apply the weekly seasonal adjustment to get the important result.
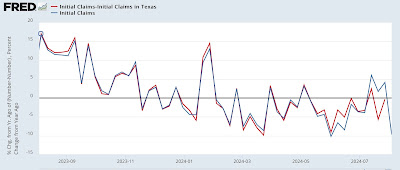
And indeed, when you subtract Texas, YoY jobless claims (red in the graph below) are still lower than they were last July:
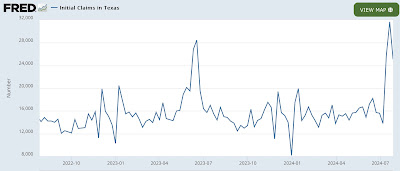
In July 2023, initial claims in Texas, not seasonally adjusted, averaged about 16,000. This year, beginning with the week of July 13, they spiked as high as 32,000 during the week of July 20. The next week they fell to just over 25,000, and this week [not yet updated on the FRED graph] they declined again to a little over 20,000:
When we take the YoY increase in Texas out of the total, NSA initial claims were about 207,600 during the week of July 27, and 199,000 this week. The seasonal adjustment for both weeks is roughly +15%. When we then apply that seasonal adjustment, we get 240,000 initial claims last week, and 228,000 this week.
What this means is that initial claims ex-Texas remained lower during all but one week in July, and were lower still this week. In other words, when we take out the Beryl-related distortions, initial jobless claims have remained lower YoY, in line with the unresolved post-pandemic seasonality hypothesis.
Last year initial claims declined sharply as August progressed, to under 220,000. So the ultimate test of my hypothesis for the increase we have been seeing this summer will take place over the next 4-5 weeks.
But for now, importantly, initial jobless claims are not forecasting a recession at all, but rather continued growth.
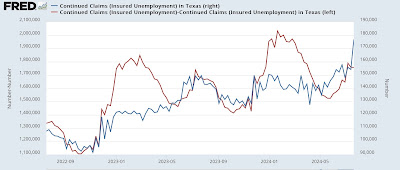
UPDATE: The same is true for continuing claims. These spiked in TX by 20,000 one week after initial claims did (note: most current state data is only through July 20):
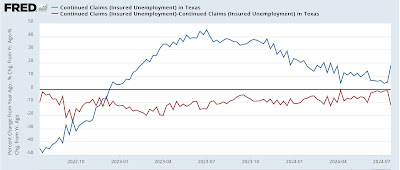
Because these are not seasonally adjusted, here’s what the YoY numbers look like (blue in graph below is TX; red is all States ex-TX):
When we take out the TX spike, continued claims were only 1.891 million NSA for the week of July 20. Applying the seasonal adjustment of .966% gives us 1.805 million ex-hurricane distortions, only 1.7% higher than the same week last year – the best YoY reading all this year for continuing claims.
The Bonddad Blog
Jobless claims increase, no longer positive and neutral, Angry Bear by New Deal democrat

