– by New Deal democrat This morning’s jobless claims report continued the uptrend we’ve seen for the past month. But it still looks more likely than not that it is mainly unresolved post-pandemic seasonality. We’ll probably get a more definitive answer to that issue in th next several weeks. Initial Jobless claims declined 5,000 for the week to 238,000. The 4 week moving average rose 5,500 to a new 9 month high of 232,750. With the typical one week delay, continuing claims rose 15,000 to 1.828 million, a 5 month high: Note that last year followed a very similar trajectory from lows of just over 200,000 in January, rising through early spring before more sharply increasing in late May and June. But as the below graph shows, on a YoY% basis
Topics:
NewDealdemocrat considers the following as important: jobless claims, US EConomics
This could be interesting, too:
NewDealdemocrat writes JOLTS revisions from Yesterday’s Report
Bill Haskell writes The North American Automobile Industry Waits for Trump and the Gov. to Act
Bill Haskell writes Families Struggle Paying for Child Care While Working
Joel Eissenberg writes Time for Senate Dems to stand up against Trump/Musk
– by New Deal democrat
This morning’s jobless claims report continued the uptrend we’ve seen for the past month. But it still looks more likely than not that it is mainly unresolved post-pandemic seasonality. We’ll probably get a more definitive answer to that issue in th next several weeks.
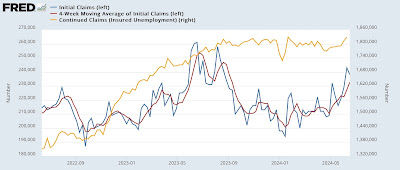
Initial Jobless claims declined 5,000 for the week to 238,000. The 4 week moving average rose 5,500 to a new 9 month high of 232,750. With the typical one week delay, continuing claims rose 15,000 to 1.828 million, a 5 month high:
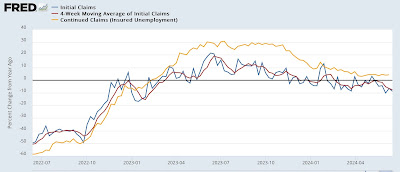
Note that last year followed a very similar trajectory from lows of just over 200,000 in January, rising through early spring before more sharply increasing in late May and June. But as the below graph shows, on a YoY% basis this year’s iinitial claims have been almost uniformly lower:
In fact, on a YoY basis, initial claims this week were down -8.8%, and the four week average down -7.5%, respectively the second best, and best, comparisons in 18 months. Since the YoY figures are more reliable as recession forecasting tools, these remain very positive. Even continuing claims, which are up 4.3% YoY, remain close to their 15 month low comparison.
If hidden seasonality is the culprit, we should know shortly. That’s because as shown in the first graph above last year there was a sharp decline in claims beginning the week of June 24. Next week will be the equivalent week this year. So if claims continue at their recent elevated levels for two more weeks, that would negative the seasonality theory. We’ll see.
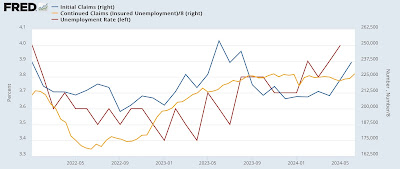
Meanwhile, comparing monthly initial and continuing claims to the unemployment rate does not support the most recent increase to 4.0% in the latter:
As I’ve noted many times, there is a solid 50+ year history of initial (and continuing) claims leading the unemployment rate. Aside from the last few months, the only exceptions have been during the “jobless recoveries” immediately following the 1991, 2001, and 2008 recessions. This time around it is more likely due to an increasing share of the wave of recent immigrants (who have not been previously employed and are not eligible for jobless benefits) failing to find work. In other words, the “Sahm Rule” might be signaling a relatively weakening, but still positive labor market, rather than an economy that is close to recession.


