– by New Deal democrat With this morning’s release of new home sales, we have all of the important housing data releases for the month. So let’s integrate that into the overall housing outlook. Let’s begin with my usual overview that new home sales are the single most leading metric for the entire sector, but they suffer from the fact that they are extremely volatile and also heavily revised. So it is best to look at them in comparison with single family permits, which are almost as leading and have a much better signal to noise ratio. August data confirms that caution, as they declined -4.6% on a month over month basis, but from a nearly 2% upward revision to July. On a three month moving average basis, they are at their highest level in
Topics:
NewDealdemocrat considers the following as important: 2024, housing, US EConomics
This could be interesting, too:
NewDealdemocrat writes JOLTS revisions from Yesterday’s Report
Bill Haskell writes The North American Automobile Industry Waits for Trump and the Gov. to Act
Bill Haskell writes Families Struggle Paying for Child Care While Working
Joel Eissenberg writes Time for Senate Dems to stand up against Trump/Musk
– by New Deal democrat
With this morning’s release of new home sales, we have all of the important housing data releases for the month. So let’s integrate that into the overall housing outlook.
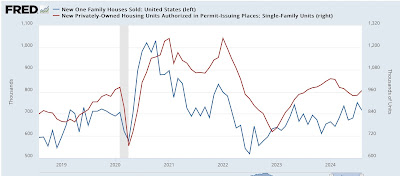
Let’s begin with my usual overview that new home sales are the single most leading metric for the entire sector, but they suffer from the fact that they are extremely volatile and also heavily revised. So it is best to look at them in comparison with single family permits, which are almost as leading and have a much better signal to noise ratio.
August data confirms that caution, as they declined -4.6% on a month over month basis, but from a nearly 2% upward revision to July. On a three month moving average basis, they are at their highest level in over a year (blue in the graph below). As you can see, in the past several years single family permits (red) have followed with a several month delay. New home sales tell us that the uptick in permits in August was probably the beginning of an upward trend to follow new home sales:
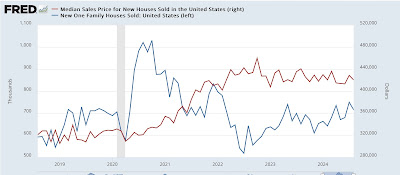
As I also usually reiterate, sales (blue again) lead prices (red, right scale):
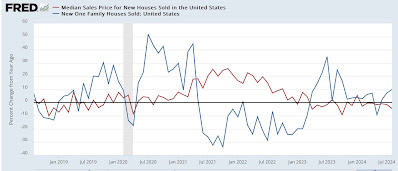
The boom in prices followed the boom in sales, and as sale cooled off sharply, prices stalled. Here is the same data in a YoY format, which shows the leading/lagging relationship a little more clearly:
New home sales bottomed in 2022, and the trend has been higher for over a year. As of last month, they are 9.8% higher YoY. Prices are still lower YoY by 4.6%, the lowest comparison in 10 months, but can be expect to move higher soon.
In the past number of months, I have been looking for a rebalancing of new vs. existing home sales. The sharp increase in mortgage rates beginning in 2022 locked many existing homeowners into their houses, since they could not afford the concomitant increase in mortgage payments that would accrue from moving. This depressed existing home sales, but drove up prices due to the very limited supply.
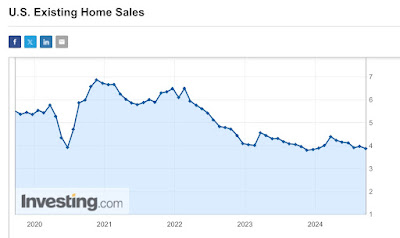
Last Friday we saw that existing home sales continues near the bottom of their 18 month range, at 3.86 million annualized:
Perhaps more importantly, the YoY% change in prices continued to moderate (below graph shows non-seasonally adjusted data):
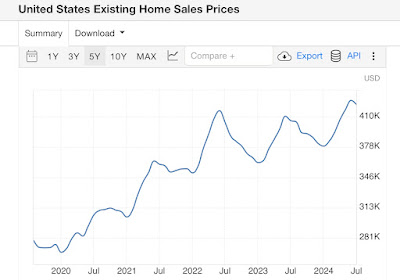
On a YoY basis, in response to the longer term decline in inventory, existing home prices have risen consistently since 2014, and accelerated during the COVID shutdowns. After briefly turning negative YoY in early 2023, troughing at -3.0% in May, comparisons accelerated almost relentlessly to a YoY peak of 5.8% in May of this year. Since then the YoY comparisons have decelerated to 4.1% in June, 4.2% in July, and only 3.1% in this month’s report.
This sharp decleration in existing home prices mirrors the repeat sales price deceleration we saw yesterday in the Case-Shiller and FHFA reports.
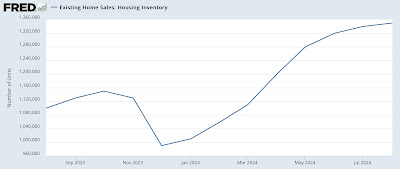
Meanwhile the inventory of existing homes is up sharply, by 22.7% YoY:
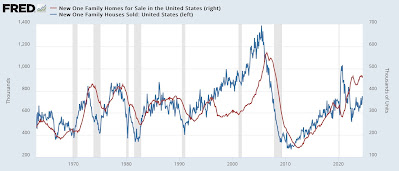
And the inventory on new single family homes (red, right scale in the graph below) is up 9.1% YoY. I have used the long term historical graph to show that sales (blue) peak first, and inventory later; and even more importantly that with the sole exception of 1969, inventory has always turned down by a few months to over a year in advance of a recession:
The bottom line for this month is that the rebalancing of the housing market is continuing, as lower mortgage rates help in the sales of new homes, which has helped drive down demand somewhat for existing homes, which in turn has led to an abatement in their price increases and an increase in inventory. A rebound in housing would be the most potent element of a “soft landing” vs. any oncoming recession.
The Bonddad Blog
7%+ mortgages weigh on new home sales, while prices continue slight downtrend, and inventory uptrend, Angry Bear by New Deal democrat

