Repeat home sales were benign in May, forecast continued downtrend in shelter CPI in months ahead – by New Deal democrat First, a brief administrative note: I am traveling this week, so posting is going to be sporadic and delayed. I’ll get to this morning’s JOLTS report later today or tomorrow morning. With that out of the way, let’s take a look at repeat home sales prices. To reiterate my focus, in the housing data I am looking at any movement towards rebalancing between new and existing home sales. As to existing home sales, what this means is increasing inventories and more stable or even slightly declining prices. We did see another increase in inventory last week. In the repeat sales index, I am looking for signs that price increases
Topics:
NewDealdemocrat considers the following as important: 2024, July, new and existing home sales, US EConomics
This could be interesting, too:
NewDealdemocrat writes JOLTS revisions from Yesterday’s Report
Bill Haskell writes The North American Automobile Industry Waits for Trump and the Gov. to Act
Bill Haskell writes Families Struggle Paying for Child Care While Working
Joel Eissenberg writes Time for Senate Dems to stand up against Trump/Musk
Repeat home sales were benign in May, forecast continued downtrend in shelter CPI in months ahead
– by New Deal democrat
First, a brief administrative note: I am traveling this week, so posting is going to be sporadic and delayed. I’ll get to this morning’s JOLTS report later today or tomorrow morning.
With that out of the way, let’s take a look at repeat home sales prices.
To reiterate my focus, in the housing data I am looking at any movement towards rebalancing between new and existing home sales. As to existing home sales, what this means is increasing inventories and more stable or even slightly declining prices. We did see another increase in inventory last week. In the repeat sales index, I am looking for signs that price increases might be abating.
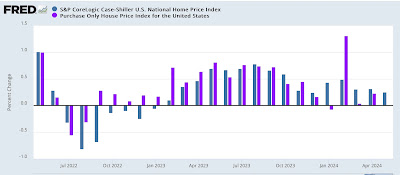
And that is what was shown this morning. The monthly comparisons were unchanged in the slightly leading FHFA index, and comparable to the last 6 months in the Case Shiller national index. Since the YoY comparisons are against 0.6% and 0.7% increases monthly last year, the YoY% increases also show deceleration.
The unchanged reading in the FHFA (purple below) is tied with January and March for the lowest change since August 2022. For Case Shiller (blue) it is near the low end of recent monthly changes, and the last 6 months in general have been the lowest since February 2023:
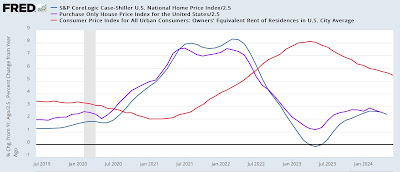
On a YoY basis, the FHFA index is up 5.7%, the lowest since last August. The Case Shiller’s YoY increase is the lowest since last December:
Again, the FHFA tends to lead the Case Shiller index by a month or two, so the direction is good.
Because the house price indexes lead the shelter component of the CPI (red above) by 12-18 months, this means we can expect continued deceleration in that very important component of consumer prices as well.
This means that Owners Equivalent Rent, which is 25% of the entire CPI, should continue to trend towards 3% YoY increases in the months ahead.
This is a good report which should give the Fed more reason to be comfortable beginning to cut interest rates.
The Bonddad Blog
House prices – especially for existing homes – compared with wages remain near or at all-time highs, so existing homes make up less of the market – Angry Bear by New Deal democrat


