Only the top 20% saves. Originally published at Wealth Economics Newly released data series from the Bureau Economic Analysis have revealed a pretty eye-popping economic reality that’s been invisible in the national accounts…forever. Subtract households’ Personal Taxes and Personal Outlays from Personal Income to yield Personal Saving, and it turns out that the bulk of U.S. households don’t save. Quite the contrary: the bottom 80% spends more than its income, year in and year out. Only the top 20% consistently saves.1 This reality was invisible before publication of the Distribution of Personal Income Accounts (here, the “DPIAs”), first released in December 2020 and now in its fourth (greatly improved) prototype version, released December
Topics:
Steve Roth considers the following as important: Education, US/Global Economics
This could be interesting, too:
Joel Eissenberg writes How Tesla makes money
Angry Bear writes True pricing: effects on competition
Angry Bear writes The paradox of economic competition
Angry Bear writes USMAC Exempts Certain Items Coming out of Mexico and Canada
Only the top 20% saves.
Originally published at Wealth Economics
Newly released data series from the Bureau Economic Analysis have revealed a pretty eye-popping economic reality that’s been invisible in the national accounts…forever. Subtract households’ Personal Taxes and Personal Outlays from Personal Income to yield Personal Saving, and it turns out that the bulk of U.S. households don’t save. Quite the contrary: the bottom 80% spends more than its income, year in and year out. Only the top 20% consistently saves.1
This reality was invisible before publication of the Distribution of Personal Income Accounts (here, the “DPIAs”), first released in December 2020 and now in its fourth (greatly improved) prototype version, released December 2023. It provides breakdowns of Personal Income and Personal Taxes by income deciles — top 10%, next 10%, etc. — currently for twenty-two years 2000 through 2021.2 The situation revealed in this post was simply invisible before the DPIAs were released.
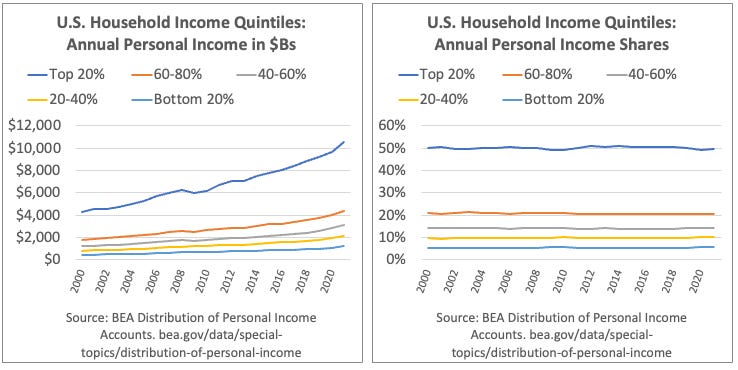
Meanwhile the BLS Consumer Expenditure Survey (CEX) provides income-quintiles’ annual spending shares, going back to 1984.3

Subtract an income-quintile’s outlays (spending and consumer-interest payments) from disposable income, and you’ve got Personal Saving for that quintile group. Divide that by disposable income, and you get the standard-issue Personal Saving Rate.

What in the actual hell? How can households maintain a spending deficit over decades, without running out of assets to spend? Spending is transferring assets to firms (mostly), in exchange for newly-produced goods and services. If you don’t have assets, you can’t spend.
The answer lies in the first footnote here. Personal Income isn’t the only source of household assets. The two big missing pieces are holding (capital) gains on assets, and borrowing (which adds both assets and liabilities, in equal amounts, to household balance sheets). Adding these two additional measures does shift most bottom quintiles from spending deficits to asset surpluses in most years.
Bottom-80% borrowing and and holding gains, as a percent of bottom-80% spending deficits. Post-GFC, pre-covid years.

While many have suggested that borrowing is what explains households’ ability to keep spending (it is, some), overwhelmingly it’s holding gains that “fund” the perennial dissaving of the bottom 80%.
For those who’d like more details, here’s a pared-down version of the spreadsheet that includes the data and graphs (but not all the derivations of that data). A new, full version of this paper and spreadsheet will be available in the next few weeks, incorporating all the latest national accounting data and multiple other improvements.
As always, comments, questions, and corrections from my gentle readers are greatly appreciated.
1 It’s important to note that the Personal Income measure ignores holding gains income (and some other smaller measures) — a very large chunk of households’ asset accumulation over years, decades, and generations. The same is true of National Income, the measure at the heart of Piketty & co.’s Distributional National Accounts, or DINAs. This post (at least until the very end) only deals with the Personal series, the measures used by almost every economist for economic modeling, and for evaluating economic inequality.
2 The DPIA’s deciles are easily summed into quintiles. They bring to fruition unfulfilled efforts toward distributional accounting that go back to Simon Kuznets (the godfather of U.S. national accounting) in the 1930s and after, and particularly to Selma Goldsmith, whose efforts in the 1950s were woefully under-resourced (woman’s work?) and sadly came to an end with her untimely death at age 50. Impressive recent efforts by non-government researchers over the last decade+, notably Piketty, Saez, Zucman and company, have tackled distributional accounting, but their available series only break out income by the bottom 50%, next 40%, top 10%, 1%, and above. The DPIAs’ deciles provide a far more detailed bottom-to-top picture of income distribution that make the findings here possible. Many might find it perplexing that economists have failed to request (or even demand) such distributional breakouts from national accountants over nearly a century. More jaded observers, noting economists’ solid position in the top 20% and above, find it less surprising.
3 The CEX survey does not capture all spending/outlays. But it does provide by far the best estimate of each income-quintile’s percent share of total outlays. The results are very consistent over decades. Multiply a quintile’s percent share by the BEA’s comprehensive aggregate Personal Consumption Expenditures (PCE) measure, and you get that quintile’s consumption spending.