By Steve Roth Wealth Economics This post is prompted by Matthew Klein’s (very wonky) post about recent changes in QE/QT, and the Fed’s balance sheet. It prompted me to do a quick calculation that I’ve been meaning to get to: when household wealth increases (due to stock-market price runups or really anything else), what effect does that have on household spending in the next year? I’m going to start with a bald two-part claim. A. The overwhelming effect/mechanism/transmission-channel for QE/QT is via equity prices. QE gooses share prices. It “fills up the punchbowl.” QT takes it away, or at least restrains those runups. B. There’s a resulting (weak) “wealth effect.” If people have more money/assets/wealth, they spend more. The
Topics:
Steve Roth considers the following as important: US EConomics, wealth
This could be interesting, too:
NewDealdemocrat writes JOLTS revisions from Yesterday’s Report
Bill Haskell writes The North American Automobile Industry Waits for Trump and the Gov. to Act
Bill Haskell writes Families Struggle Paying for Child Care While Working
Joel Eissenberg writes Time for Senate Dems to stand up against Trump/Musk
by Steve Roth
Wealth Economics
This post is prompted by Matthew Klein’s (very wonky) post about recent changes in QE/QT, and the Fed’s balance sheet. It prompted me to do a quick calculation that I’ve been meaning to get to: when household wealth increases (due to stock-market price runups or really anything else), what effect does that have on household spending in the next year?
I’m going to start with a bald two-part claim.
A. The overwhelming effect/mechanism/transmission-channel for QE/QT is via equity prices. QE gooses share prices. It “fills up the punchbowl.” QT takes it away, or at least restrains those runups.
B. There’s a resulting (weak) “wealth effect.” If people have more money/assets/wealth, they spend more.
The wealth effect is weak, because:
1. The top 20% of income recipients own 87% of equity assets. (Aside: the top 10% of wealthholders own . . . 87% of equity shares.)
And:
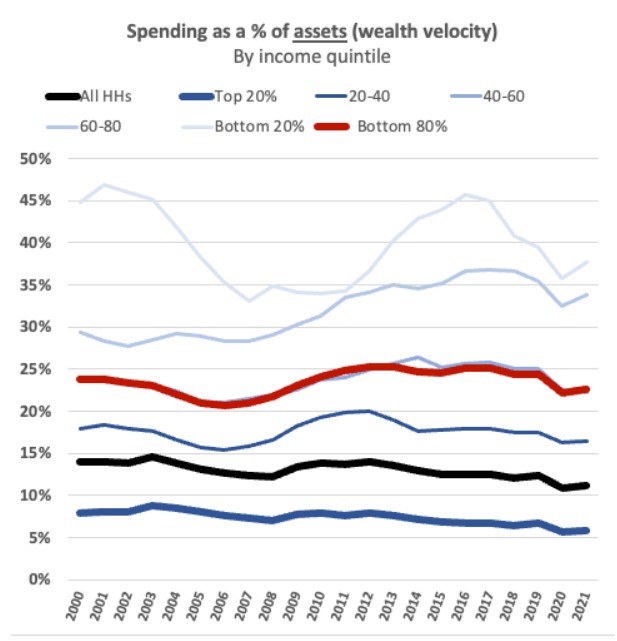
2. “Velocity of wealth”: The top 20% of income recipients only turn over about 5% of their wealth in spending each year. The bottom 80% turn over about 25% a year. These are quite consistent velocities over the past 20+ years (though the top quintile’s velocity had trended down). We can assume they won’t change very much in the next year.
So for every 1% increase in household equity asset holdings (currently a ~$625B increase), the next year’s spending increases by .17%:
This is only counting the wealth-driven extra spending over the next year. It continues for ensuing years, though perhaps at a decaying rate. (Calculating that decay rate would require some quite muscular assumptions compared to the fairly straightforward arithmetic here.)
QE/QT don’t only affect equity-asset prices, of course. And equity assets are only 35% of household-sector total assets. But I hope this envelope-calc helps give my gentle readers a sense of magnitude, at least, when considering the “wealth effect” of government’s monetary and fiscal actions.


