Repeat sales house price indexes continue to increases on par with past expansions – by New Deal democrat House prices lag home sales, which in turn lag mortgage rates. Yesterday we got the final January reading on sales. This morning, we got the final monthly (for December) read on prices, for repeat sales of existing homes. The FHFA purchase only price index rose 0.1% on a seasonally adjusted basis, and is up 6.6% YoY. Meanwhile the Case Shiller National index rose 0.2% for the month, and was is up 5.1% YoY. Here’s what the monthly numbers look like for the past five years: Note that this month’s increase was the lowest since last January for both indexes. Further, although the 6.6% and 5.1% YoY increases appear to be major, the
Topics:
NewDealdemocrat considers the following as important: housing, US EConomics
This could be interesting, too:
NewDealdemocrat writes JOLTS revisions from Yesterday’s Report
Bill Haskell writes The North American Automobile Industry Waits for Trump and the Gov. to Act
Bill Haskell writes Families Struggle Paying for Child Care While Working
Joel Eissenberg writes Time for Senate Dems to stand up against Trump/Musk
Repeat sales house price indexes continue to increases on par with past expansions
– by New Deal democrat
House prices lag home sales, which in turn lag mortgage rates. Yesterday we got the final January reading on sales. This morning, we got the final monthly (for December) read on prices, for repeat sales of existing homes.
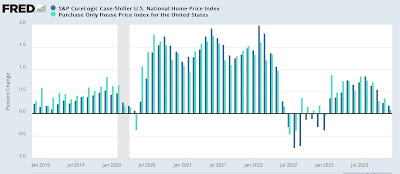
The FHFA purchase only price index rose 0.1% on a seasonally adjusted basis, and is up 6.6% YoY. Meanwhile the Case Shiller National index rose 0.2% for the month, and was is up 5.1% YoY. Here’s what the monthly numbers look like for the past five years:
Note that this month’s increase was the lowest since last January for both indexes.
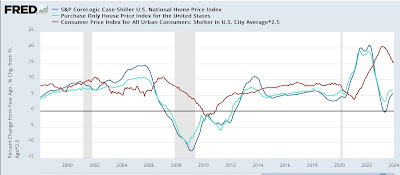
Further, although the 6.6% and 5.1% YoY increases appear to be major, the long term graph of both of them below, compared with the CPI for shelter (red, *2.5 for scale) shows that this is actually similar to gains during the majority of the past 25 years outside of recessions:
For the month, the YoY increase in the FHFA index declined -0.1% from 6.7% in November, while the YoY increase in the Case Shiller index rose 0.5% from November’s 5.1%. As shown in the first graph above, this is because we had a period of actual declines in prices late in 2022. If present trends continue, these YoY comparisons will drop out in two months, and the YoY deceleration will continue.
It is likely that chronic under-building of houses in the decade after the Great Recession has much to do with such price increases outstripping worker pay.
Additionally, because house prices lead “Owners’ Equivalent Rent” in the CPI, the above graph shows that we can expect further declines toward the more normal 2.5%-3.0% YoY range over the coming months in that very important inflation metric.
Consumer inflation remains all about the lagged effect of house prices, Angry Bear, by New Deal democrat.


