Summary:
Don’t trust summary statistics alone When teaching statistics and econometrics yours truly always stress the importance of data visualization. The thirteen datasets shown above is a great illustration of why one should always plot data. They all have the same summary statistics — mean, standard deviation, correlation coefficient — but some are dinosaurs and others are stars … Conclusion: never trust summary statistics alone! Advertisements
Topics:
Lars Pålsson Syll considers the following as important: Statistics & Econometrics
This could be interesting, too:
Lars Pålsson Syll writes Keynes’ critique of econometrics is still valid
Lars Pålsson Syll writes The history of random walks
Lars Pålsson Syll writes The history of econometrics
Lars Pålsson Syll writes What statistics teachers get wrong!
Don’t trust summary statistics alone
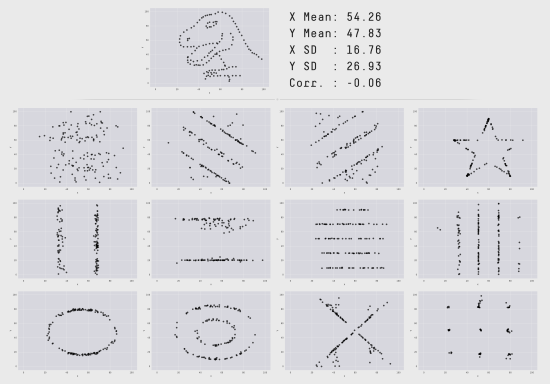
When teaching statistics and econometrics yours truly always stress the importance of data visualization. The thirteen datasets shown above is a great illustration of why one should always plot data. They all have the same summary statistics — mean, standard deviation, correlation coefficient — but some are dinosaurs and others are stars …
Conclusion: never trust summary statistics alone!

Advertisements