Summary:
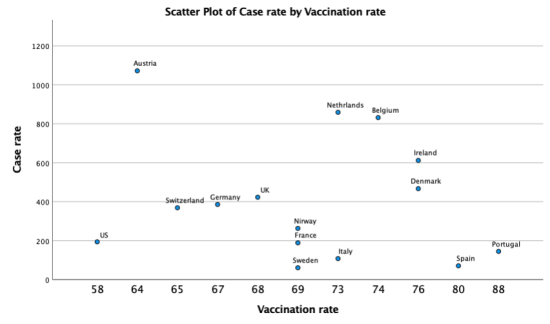
If we make a Pearson’s correlation analysis on the variables in the scatterplot above — the corona vaccination rate and the (7 day) case rate per 100 000 people (data from last week) — we get an r = -0,15. And still in the youtube video below Sahra Wagenknecht says there is “keine Zusammenhang” between vaccination rate and case rate for the countries in the plot. Maybe someone ought to teach high-profile anti-vaxxers some basic statistics … .[embedded content]
Topics:
Lars Pålsson Syll considers the following as important: Statistics & Econometrics
This could be interesting, too:
Lars Pålsson Syll writes Keynes’ critique of econometrics is still valid
Lars Pålsson Syll writes The history of random walks
Lars Pålsson Syll writes The history of econometrics
Lars Pålsson Syll writes What statistics teachers get wrong!
If we make a Pearson’s correlation analysis on the variables in the scatterplot above — the corona vaccination rate and the (7 day) case rate per 100 000 people (data from last week) — we get an r = -0,15. And still in the youtube video below Sahra Wagenknecht says there is “keine Zusammenhang” between vaccination rate and case rate for the countries in the plot. Maybe someone ought to teach high-profile anti-vaxxers some basic statistics …
.