Chart below showing the 10-yr UST rate over the 6 months of US govt Treasury operations under the so-called "debt ceiling!" and to present.You can see at Point A, which is the recent high in the yield, the date is March 14th which is the last day Treasury could net issue UST securities before the "debt ceiling!" was hit the next day March 15th.Then at Point B, which is the recent bottom in the yield, the date is September 8th, which is the recent day the "debt ceiling!" was again suspended until December 8th when Trump made his deal with Chuck and Nancy and f-ed Mitch and Paul.These are top and bottom ticks to the day... checkmate .... sorry.... Rote textbook MMT 101: "US Treasury issuance is an interest rate maintenance operation..." or "US Treasury issuance is a reserve drain so
Topics:
Mike Norman considers the following as important:
This could be interesting, too:
Robert Vienneau writes Austrian Capital Theory And Triple-Switching In The Corn-Tractor Model
Mike Norman writes The Accursed Tariffs — NeilW
Mike Norman writes IRS has agreed to share migrants’ tax information with ICE
Mike Norman writes Trump’s “Liberation Day”: Another PR Gag, or Global Reorientation Turning Point? — Simplicius
Chart below showing the 10-yr UST rate over the 6 months of US govt Treasury operations under the so-called "debt ceiling!" and to present.
You can see at Point A, which is the recent high in the yield, the date is March 14th which is the last day Treasury could net issue UST securities before the "debt ceiling!" was hit the next day March 15th.
Then at Point B, which is the recent bottom in the yield, the date is September 8th, which is the recent day the "debt ceiling!" was again suspended until December 8th when Trump made his deal with Chuck and Nancy and f-ed Mitch and Paul.
These are top and bottom ticks to the day... checkmate .... sorry....
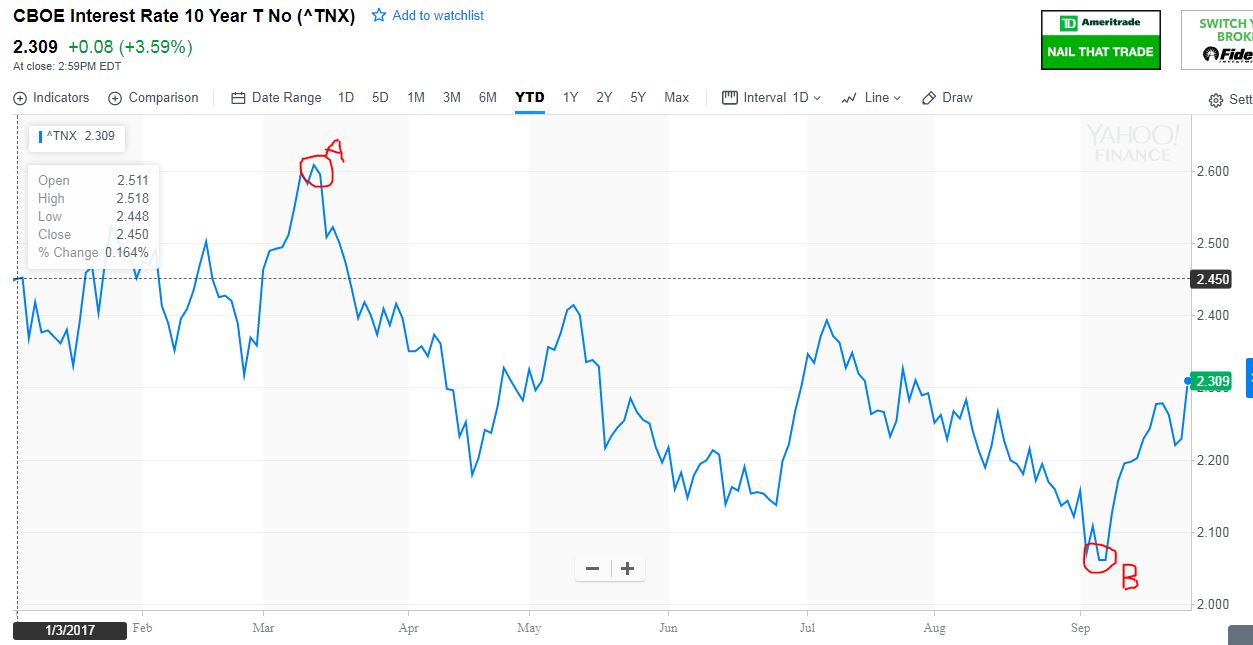
Rote textbook MMT 101: "US Treasury issuance is an interest rate maintenance operation..." or "US Treasury issuance is a reserve drain so interest rates don't collapse..."
You can see that during the 6 months at the ceiling, as US Treasury had no ability to drain new reserve assets being created via the Treasury 'extraordinary measures', the 10 year rate was collapsing and, if given a bit more time, would have eventually converged with the current policy rate supported via the IOR at 1.25%.
So what we want to see now currently is a continuation in this uptrend in the rates out the curve until at least the date of December 8th at which time the current "debt ceiling!" suspension is scheduled to end.
If they don't raise the debt ceiling by or at that time and instead go on another 6 months of reserve creation via the 'extraordinary measures' into 2018 we would want to see the bonds again rally and the rates out the curve start to again collapse towards the policy rate with Treasury having no ability to drain newly created reserve assets until the "ceiling!" would eventually be raised or again suspended.
(FD: Currently short 2 March '18 10-yr UST Futures until at least December 8th... not a recommendation.)