Time domain graph (abstraction) below quantifying the policy of US banking system Reserve Asset levels as percent of US GDP over time for about the last 100 years. Color lines added to identify periods of time between significant transitions of the policy.Starting from left, green line identifies a period of time post WW1 where the reduction caused economic out performance known figuratively as 'The Roaring Twenties!'.... Red line identifies a period of time when a large and fast increase caused the 1929 large and fast equity shares price reduction known figuratively as "The Crash" the increase continued for another 10 years causing a period of economic under performance known figuratively as "The Great Depression!"...Blue line identifies a long and slow period of reduction which
Topics:
Mike Norman considers the following as important:
This could be interesting, too:
Robert Vienneau writes Austrian Capital Theory And Triple-Switching In The Corn-Tractor Model
Mike Norman writes The Accursed Tariffs — NeilW
Mike Norman writes IRS has agreed to share migrants’ tax information with ICE
Mike Norman writes Trump’s “Liberation Day”: Another PR Gag, or Global Reorientation Turning Point? — Simplicius
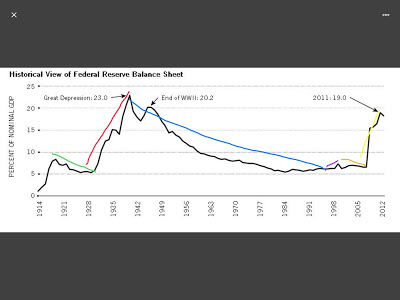
Time domain graph (abstraction) below quantifying the policy of US banking system Reserve Asset levels as percent of US GDP over time for about the last 100 years.
Color lines added to identify periods of time between significant transitions of the policy.
Starting from left, green line identifies a period of time post WW1 where the reduction caused economic out performance known figuratively as 'The Roaring Twenties!'....
Red line identifies a period of time when a large and fast increase caused the 1929 large and fast equity shares price reduction known figuratively as "The Crash" the increase continued for another 10 years causing a period of economic under performance known figuratively as "The Great Depression!"...
Blue line identifies a long and slow period of reduction which caused a long period of economic out performance throughout WW2 and the decades post war ...
Violet line a little blip up post millennium where it caused a small economic recession...
Orange line then another period of decrease which caused economic out performance until 2008...
Yellow line another period of large and fast increase which was very similar to the 1929 function as it caused another severe reduction in equity share prices (-40%) and then a period of economic under performance known figuratively as "The Great Recession!"...
This is NOT a correlation study this is identification of a Functional Relation (Abstraction).... (FD my primary training at University.)
Where the Reserve Assets increase (which via regulation causes immediate price reduction in Risk Assets followed by periods of economic under performance due to lack of availability of finance) this increase is called by the Liberal Art dialectic trained unqualified morons the figurative "pumping in money!" or they'll say simply "pumping!" or sometimes they say "injection of money!"... maybe these morons have some other figurative language descriptions...
The figurative language is a tip off to where they are making the usual cognitive error of reification (they think what are properly seen as abstractions are REAL) due to their lack of understanding of the regulatory (another abstraction) effects of the policy... e.g. they'll say "we're out of money!" and stupid stuff like that... so then they want to "pump in more money!", etc... moron-fest...
The cognitive error is predicated on a lack of proper understanding of the abstractions.
They are attempting to administer the system using only their Liberal Art dialectic method employing literal and figurative language and are not trained and qualified in proper methods of abstraction and as a result are fucking up BIG TIME...
And they are not going to be corrected by simply using more figurative language ("more framing!"); that approach doesn't work.... you can't correct a reification error via employment of even more figurative language...
In the meantime they think "pumping in the money!" is a GOOD policy... and we're at the mercy of these morons... SCAAAAAARY!!!!!

