CPI, Empire State Survey, Philly Fed, Brent Crude Price, Previous Banking Post Consumer Price IndexEmpire State Mfg Survey HighlightsMinus signs sweep the Empire State report with the headline at minus 11.36 which is more than 1 point below Econoday’s low end estimate. Looking at individual readings, new orders are in very deep trouble at minus 18.92 for a fifth straight month of contraction. And manufacturers in the region are not going to be able to turn to unfilled orders to keep busy with this reading extending a long string of contraction at minus 15.09 in September.Lack of orders is showing up in shipments, which are at minus 13.61 for a third straight contraction, and in employment which is in a second month of contraction at minus 8.49. The workweek is down and delivery times are shortening, both consistent with weakening conditions. Price data show a second month of contraction for finished goods, which is another negative signal, and a narrowing and only marginal rise for prices of raw materials.This report opens up the October look at manufacturing, and the results will raise talk that weak export markets may be taking an increasing toll on the sector. Watch later this morning for the Philly Fed report at 10:00 a.m. ET where contraction is also expected.
Topics:
WARREN MOSLER considers the following as important: Banking, inflation, Oil
This could be interesting, too:
Ken Houghton writes Time for A Few Small Repairs?
Matias Vernengo writes Serrano, Summa and Marins on Inflation, and Monetary Policy
Angry Bear writes Voters Blame Biden and Harris for Inflation
Lars Pålsson Syll writes How inequality causes financial crises
CPI, Empire State Survey, Philly Fed, Brent Crude Price, Previous Banking Post
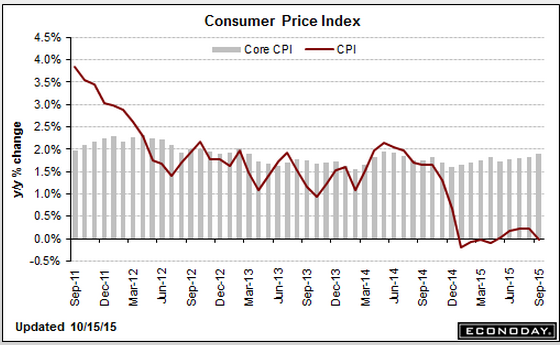
Consumer Price Index
Empire State Mfg Survey
Highlights
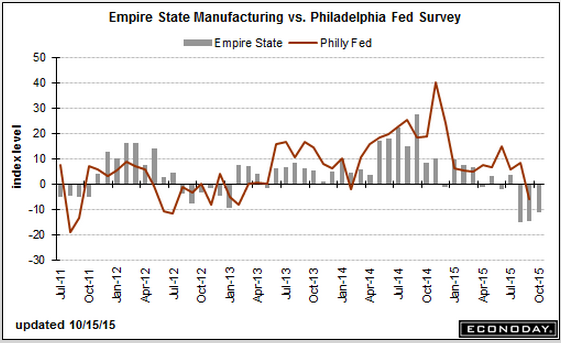
Minus signs sweep the Empire State report with the headline at minus 11.36 which is more than 1 point below Econoday’s low end estimate. Looking at individual readings, new orders are in very deep trouble at minus 18.92 for a fifth straight month of contraction. And manufacturers in the region are not going to be able to turn to unfilled orders to keep busy with this reading extending a long string of contraction at minus 15.09 in September.Lack of orders is showing up in shipments, which are at minus 13.61 for a third straight contraction, and in employment which is in a second month of contraction at minus 8.49. The workweek is down and delivery times are shortening, both consistent with weakening conditions. Price data show a second month of contraction for finished goods, which is another negative signal, and a narrowing and only marginal rise for prices of raw materials.
This report opens up the October look at manufacturing, and the results will raise talk that weak export markets may be taking an increasing toll on the sector. Watch later this morning for the Philly Fed report at 10:00 a.m. ET where contraction is also expected.
Philadelphia Fed Business Outlook Survey
Highlights
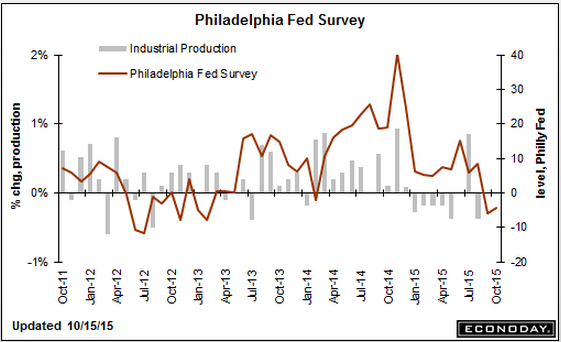
Contraction is seeping into the Mid-Atlantic manufacturing sector. The Philly Fed’s index for October, at minus 4.5, came in just below Econoday’s low-end estimate. This is the second drop in a row but, more importantly, contraction is now appearing in many of the report’s specific indexes including new orders which, at minus 10.6, fell 20.0 points from September. Unfilled orders, at minus 11.7, are extending their long contraction while shipments, at minus 6.1, are down 19.9 points from September. Employment, at minus 1.7, is now in contraction and down 11.9 points in the month. This report confirms the Empire State report released earlier this morning and points to accelerating declines for manufacturing, a sector that appears to be getting hit harder and harder by weak foreign markets.
And look when it peaked:
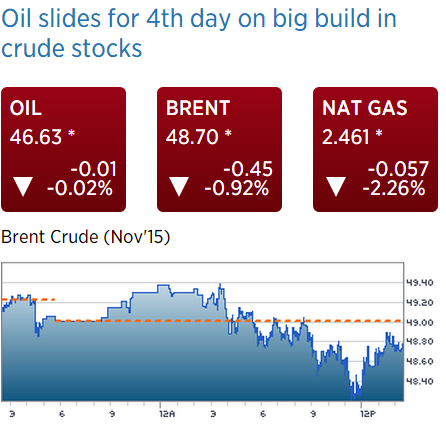
Brent still going lower. Probably keeps going down until Saudis alter their discounts:
I posted this Dec 14, 2014, and seems it’s coming into play:
Banking
Deflation is highly problematic for banks. Here’s what happened at my bank to illustrate the principle:
We had a $6.5 million loan on the books with $11 million of collateral backing it. Then, in 2009 the properties were appraised at only $8 million. This caused the regulators to ‘classify’ the loan and give it only $4 million in value for purposes of calculating our assets and capital. So our stated capital was reduced by $2.5 million, even though the borrower was still paying and there was more than enough market value left to cover us.
So the point is, even with conservative loan to value ratios of the collateral, a drop in collateral values nonetheless reduces a banks reported capital. In theory, that means if the banking system needs an 8% capital ratio, and is comfortably ahead at 10%, with conservative loan to value ratios, a 10% across the board drop in assets prices introduces the next ‘financial crisis’. It’s only a crisis because the regulators make it one, of course, but that’s today’s reality.
Additionally, making new loans in a deflationary environment is highly problematic in general for similar reasons. And the reduction in ‘borrowing to spend’ on energy and related capital goods and services is also a strong contractionary bias.


