Government hiring contributed 38,000 jobs last month and a total of almost 100,000 over the last three months: This is the jobs number before seasonal adjustments: The year over year number ‘takes out’ the seasonal factors: Note how many of the new employees were previously considered to be ‘outside the labor force’ for purposes of calculating the unemployment number: The duration of unemployment has come down but it’s still higher than it’s ever been before this cycle: So, as previously discussed, I see serious levels of ‘slack’ remaining, while employment growth continues to decelerate ever since oil capex collapsed in q4 2014. And I see no sign yet that the lost oil capex spending that supported growth before it collapsed is being replaced. This is based on a few early numbers and assumptions that get modified as more data is released over the next few months. Last quarter also started off very high, and then came down to 1.8% before the first government estimate of 1.
Topics:
WARREN MOSLER considers the following as important: Uncategorized
This could be interesting, too:
tom writes The Ukraine war and Europe’s deepening march of folly
Stavros Mavroudeas writes CfP of Marxist Macroeconomic Modelling workgroup – 18th WAPE Forum, Istanbul August 6-8, 2025
Lars Pålsson Syll writes The pretence-of-knowledge syndrome
Dean Baker writes Crypto and Donald Trump’s strategic baseball card reserve
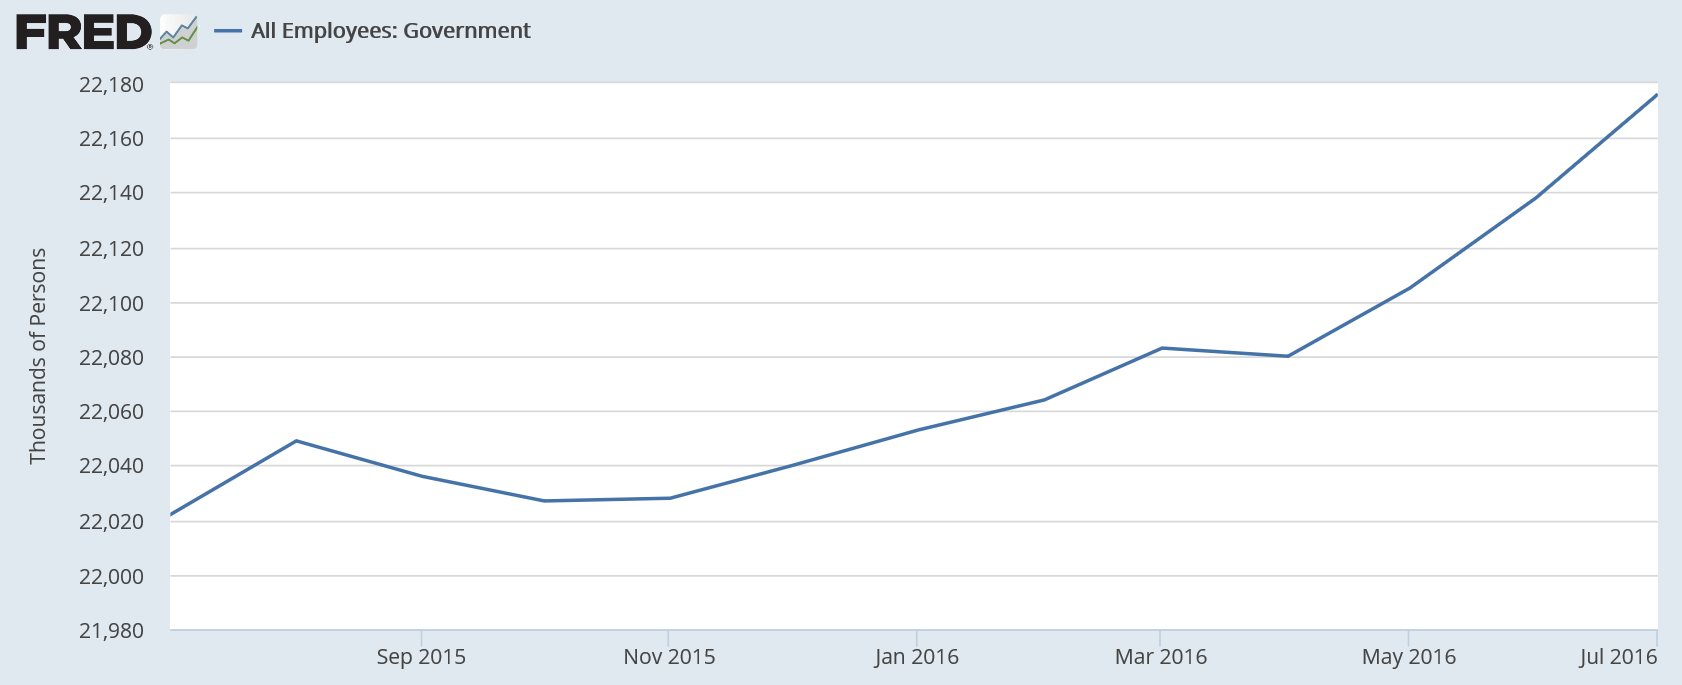
Government hiring contributed 38,000 jobs last month and a total of almost 100,000 over the last three months:
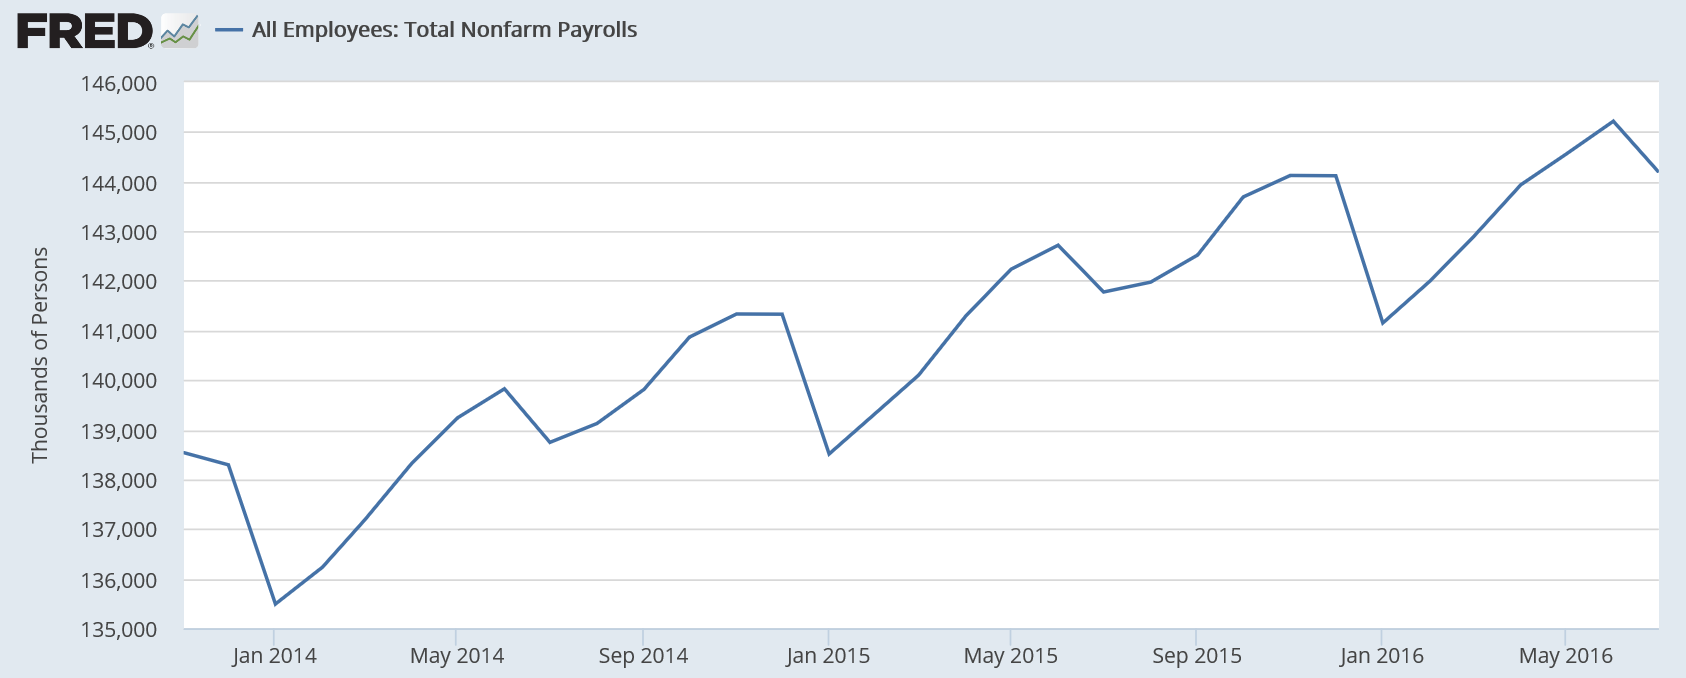
This is the jobs number before seasonal adjustments:
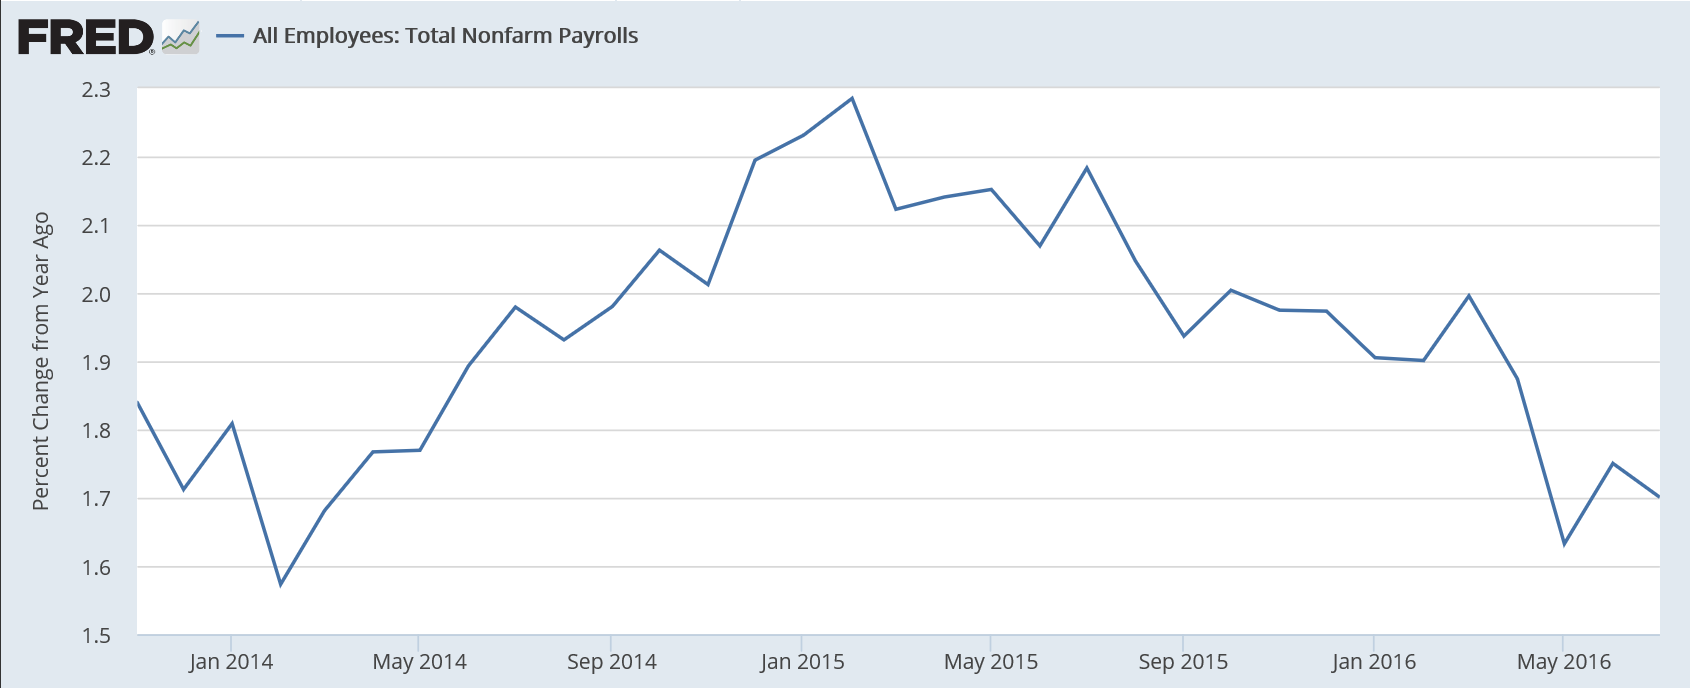
The year over year number ‘takes out’ the seasonal factors:
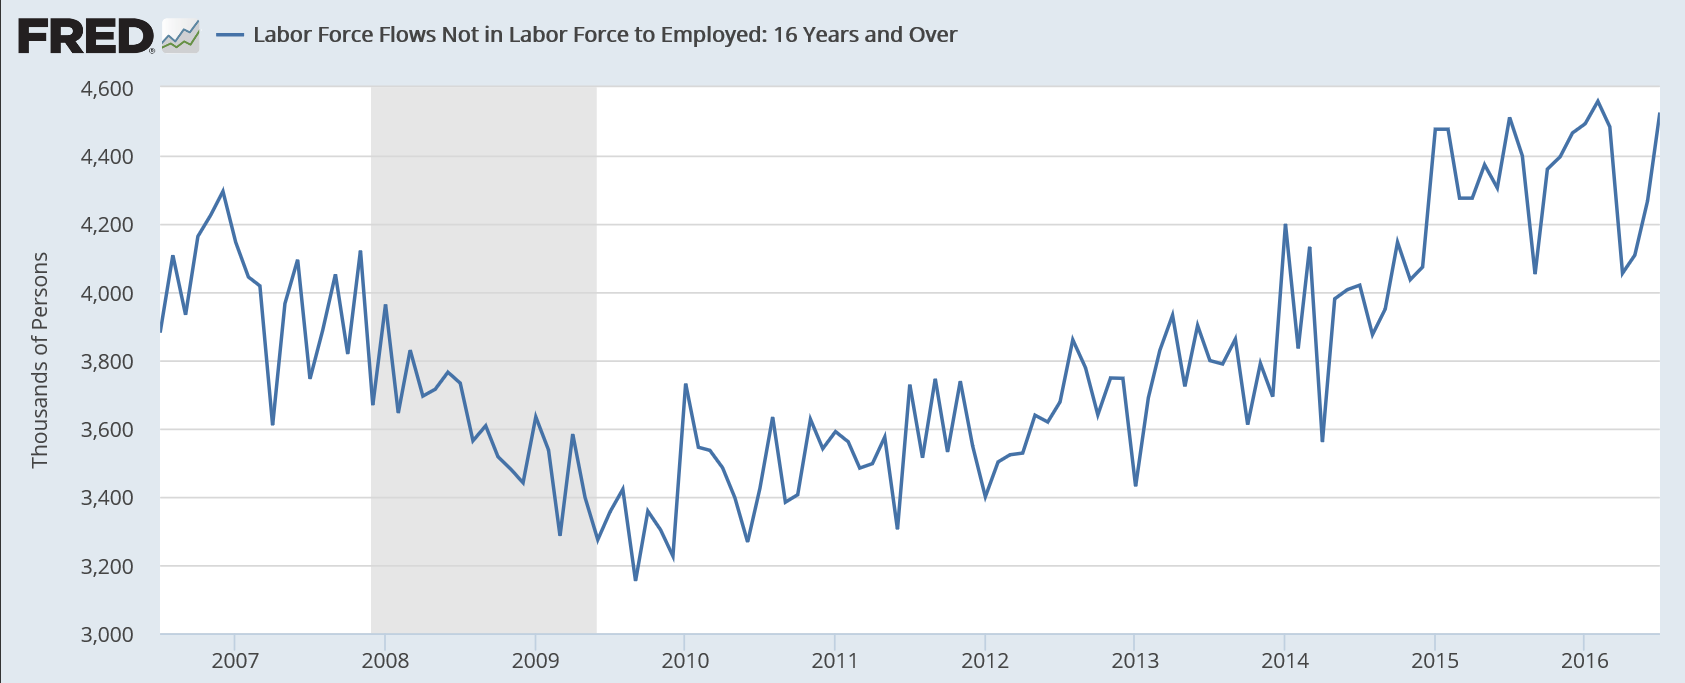
Note how many of the new employees were previously considered to be ‘outside the labor force’ for purposes of calculating the unemployment number:
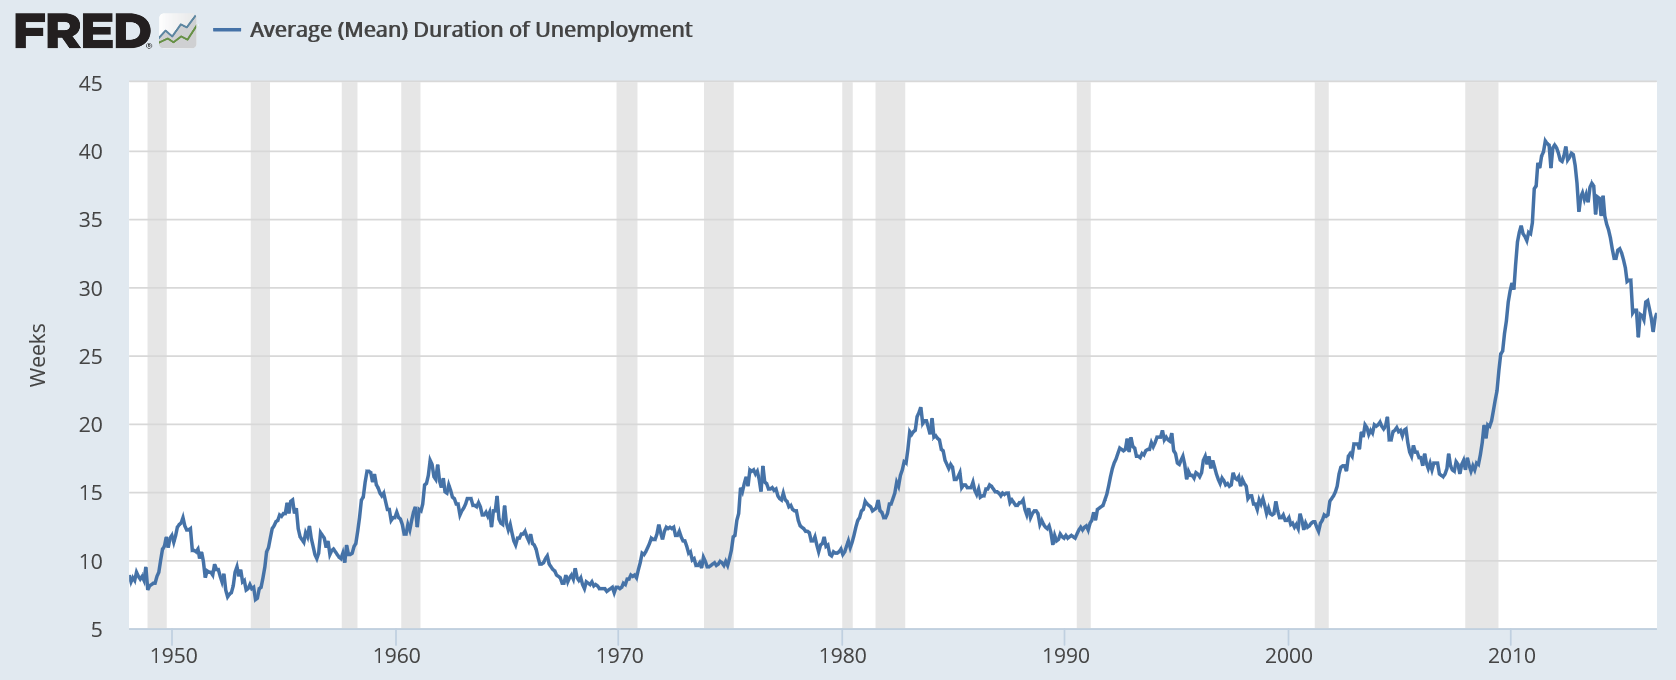
The duration of unemployment has come down but it’s still higher than it’s ever been before this cycle:
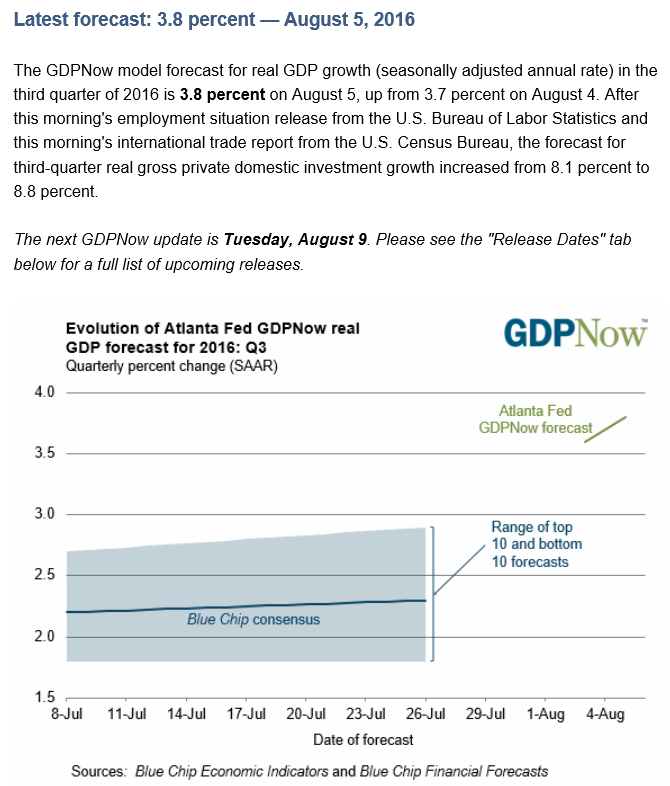
So, as previously discussed, I see serious levels of ‘slack’ remaining, while employment growth continues to decelerate ever since oil capex collapsed in q4 2014. And I see no sign yet that the lost oil capex spending that supported growth before it collapsed is being replaced.
This is based on a few early numbers and assumptions that get modified as more data is released over the next few months. Last quarter also started off very high, and then came down to 1.8% before the first government estimate of 1.2% was released: