The slow motion train wreck that began in late 2014 with the collapse of oil capex continues unabated, with no sign of reversal that I can detect, and the annual rate of growth is consistent with prior recessions: Highlights After spending heavily in the second quarter, the consumer has stepped back so far in the third quarter. Retail sales, after inching up a revised 0.1 percent in July, fell 0.3 percent in August and do not just reflect expected weakness in auto sales. Excluding autos, sales slipped 0.1 percent while excluding both autos and gasoline, which is an important core reading, sales also fell 0.1 percent which is the second straight decline. Details show special weakness for building materials and garden equipment, down 1.4 percent for what is also a second straight decline. This specific reading will lower estimates for the residential investment component of the third quarter GDP report. Non-store retailers, which were flying high in prior months, fell 0.3 percent to underscore the month’s disappointment. Motor vehicles fell 0.9 percent in the month though this does follow a 1.7 percent gain in July. This report puts the backs of the policy hawks at the Fed to the wall, confirming other signs that the third quarter may not prove that strong after all. Industrial production tells much the same story.
Topics:
WARREN MOSLER considers the following as important: Uncategorized
This could be interesting, too:
tom writes The Ukraine war and Europe’s deepening march of folly
Stavros Mavroudeas writes CfP of Marxist Macroeconomic Modelling workgroup – 18th WAPE Forum, Istanbul August 6-8, 2025
Lars Pålsson Syll writes The pretence-of-knowledge syndrome
Dean Baker writes Crypto and Donald Trump’s strategic baseball card reserve
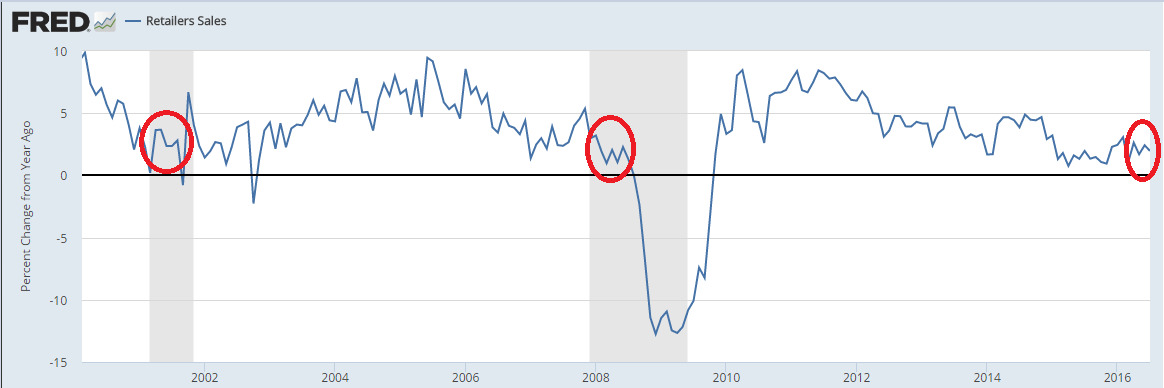
The slow motion train wreck that began in late 2014 with the collapse of oil capex continues unabated, with no sign of reversal that I can detect, and the annual rate of growth is consistent with prior recessions:
Highlights
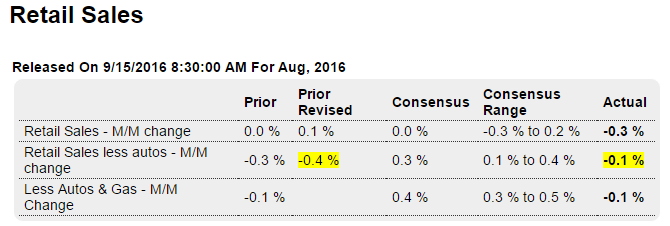
After spending heavily in the second quarter, the consumer has stepped back so far in the third quarter. Retail sales, after inching up a revised 0.1 percent in July, fell 0.3 percent in August and do not just reflect expected weakness in auto sales. Excluding autos, sales slipped 0.1 percent while excluding both autos and gasoline, which is an important core reading, sales also fell 0.1 percent which is the second straight decline.
Details show special weakness for building materials and garden equipment, down 1.4 percent for what is also a second straight decline. This specific reading will lower estimates for the residential investment component of the third quarter GDP report. Non-store retailers, which were flying high in prior months, fell 0.3 percent to underscore the month’s disappointment. Motor vehicles fell 0.9 percent in the month though this does follow a 1.7 percent gain in July.
This report puts the backs of the policy hawks at the Fed to the wall, confirming other signs that the third quarter may not prove that strong after all.
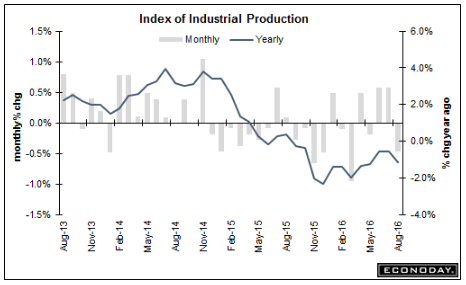
Industrial production tells much the same story. And watch for auto production to decline next month in line with falling sales:

Highlights
There was some life in the factory sector during July but it proved brief, at least for production. Held down by a 0.4 percent decline in the manufacturing component, industrial production also fell 0.4 percent in data for August. But motor vehicles continue to be a plus in the report, rising 0.5 percent and offsetting a 0.5 percent decline in hi-tech production.
And mining is an increasing plus in the report, emerging from deep weakness with a second straight gain and a solid one at plus 1.0 percent. Utility production, which had up in prior months, fell back 1.4 percent in August. Total capacity utilization edged 4 tenths lower to 75.5 percent.
This report isn’t as weak as the headline readings suggest but, given weakness in other data including this morning’s Philly Fed and Empire State reports, won’t build much confidence that the factory sector will contribute much to the nation’s third-quarter growth.
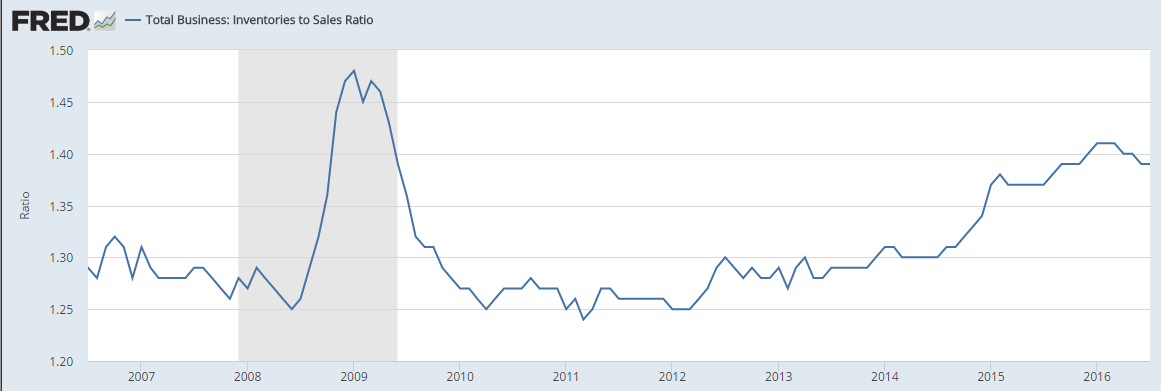
So far the expected boost to GDP from inventory building isn’t happening. Probably because, as previously discussed, sales are falling just about as fast as inventories, as the inventory to sales ratio remains elevated:

Highlights
Inventories were unchanged in lagging data for July while sales retreated 0.2 percent. The stock-to-sales ratio was unchanged at 1.39. Retail inventories fell 0.3 percent with auto inventories down 0.2 percent. Wholesale inventories were unchanged in July while inventories at manufacturers, a sector where demand is soft, edged up 0.1 percent.
An outright drop in inventory investment subtracted almost 1.3 percentage points from second quarter GDP growth — the largest drag in more than two years. Inventories have weighed on GDP growth since the second quarter of 2015. Expectations are for inventory accumulation to rebound in the third quarter adding to GDP growth.

Highlights
The Empire State report, like the bulk of this morning’s Philly Fed report, points to continuing trouble for a factory sector that is being held down by weakness in exports and weakness in business investment. September’s headline came in at minus 1.99 for a second straight contractionary reading. New orders are even more negative at minus 7.45 with unfilled orders at minus 11.61. Employment is in deep contraction, at minus 14.29, as is the workweek at minus 11.61 (same as unfilled orders). Input costs do show some pressure but not selling prices which are flat. Watch later this morning for industrial production which will cover the month of August.
In this particular survey the headline number doesn’t add up to the individual categories:

Highlights
The headline and the details of the Philly Fed report continue to take their own paths, once again showing strength at the headline level, at plus 12.8 in September, and weakness elsewhere. New orders did move into the plus column, to 1.4 vs August’s minus 7.2, but the gain is marginal. And unfilled orders remain very weak at minus 10.8. Shipments are in contraction this month, at minus 8.8, with employment at minus 5.3. Price data show some pressure for inputs but less for selling prices. This report, outside the headline, matches the weakness of the Empire State also released this morning. The nation’s factory sector seems to be dead in the water.
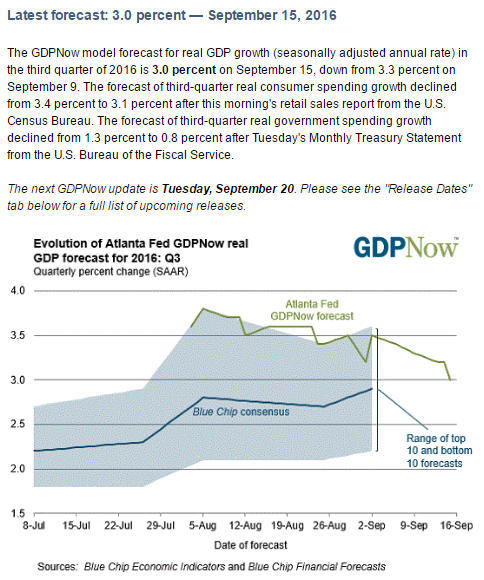
Working it’s way lower as actual data is released, as previously discussed:
