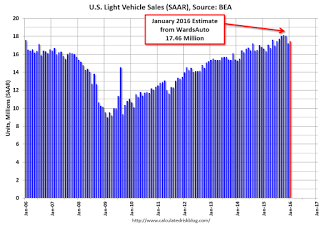
This is being spun as a positive, when all I see is a chart showing the seasonally adjusted annual rate of sales peaked several months ago and is going down: U.S. Light Vehicle Sales at 17.46 million annual rate in January Based on an estimate from WardsAuto, light vehicle sales were at a 17.46 million SAAR in January.That is up about 5% from January 2015, and up about 1.4% from the 17.2 million annual sales rate last month.This graph shows the historical light vehicle sales from the BEA (blue) and an estimate for December (red, light vehicle sales of 17.46 million SAAR from WardsAuto).This close to the consensus forecast of 17.5 million SAAR (seasonally adjusted annual rate).The second graph shows light vehicle sales since the BEA started keeping data in 1967.Vehicle SalesNote: dashed line is current estimated sales rate.This was at expectations, and vehicle sales in 2016 are off to a solid start. HighlightsUnit vehicle sales slowed going into year-end but moved higher in January, to a 17.6 million annual pace vs expectations for 17.4 and against December’s 17.3 million. Strength was centered in North American-made vehicles where the annual sales rate rose to 14.2 million vs expectations for only 13.6 million and vs 13.9 million in December. Sales of imports slowed to 3.4 million from 3.5 million.
Topics:
WARREN MOSLER considers the following as important: Uncategorized
This could be interesting, too:
tom writes The Ukraine war and Europe’s deepening march of folly
Stavros Mavroudeas writes CfP of Marxist Macroeconomic Modelling workgroup – 18th WAPE Forum, Istanbul August 6-8, 2025
Lars Pålsson Syll writes The pretence-of-knowledge syndrome
Dean Baker writes Crypto and Donald Trump’s strategic baseball card reserve
This is being spun as a positive, when all I see is a chart showing the seasonally adjusted annual rate of sales peaked several months ago and is going down:
U.S. Light Vehicle Sales at 17.46 million annual rate in January
Based on an estimate from WardsAuto, light vehicle sales were at a 17.46 million SAAR in January.
That is up about 5% from January 2015, and up about 1.4% from the 17.2 million annual sales rate last month.
This graph shows the historical light vehicle sales from the BEA (blue) and an estimate for December (red, light vehicle sales of 17.46 million SAAR from WardsAuto).This close to the consensus forecast of 17.5 million SAAR (seasonally adjusted annual rate).
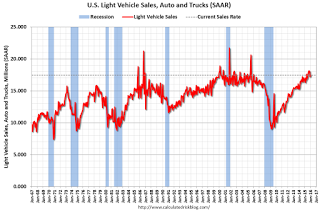
The second graph shows light vehicle sales since the BEA started keeping data in 1967.
Vehicle SalesNote: dashed line is current estimated sales rate.This was at expectations, and vehicle sales in 2016 are off to a solid start.
Highlights
Unit vehicle sales slowed going into year-end but moved higher in January, to a 17.6 million annual pace vs expectations for 17.4 and against December’s 17.3 million. Strength was centered in North American-made vehicles where the annual sales rate rose to 14.2 million vs expectations for only 13.6 million and vs 13.9 million in December. Sales of imports slowed to 3.4 million from 3.5 million. Strength on the domestic side of this report not only points to strength for vehicle manufacturing but also to strength for the motor vehicle component of the monthly retail sales report where results have been uneven. This report is another positive indication for the U.S. consumer.
Another bad report being spun as good:
Redbook
Highlights
The severe snowstorm that hit the Mid-Atlantic and Northeast held down same-store sales growth in the January 30 week, to plus a year-on-year 0.8 percent. This is the lowest weekly reading since October and, together with the 1.2 percent rate for the whole month, hints at another month of trouble for the government’s retail sales report. But the report focuses not on January but on February where it sees year-on-year sales finishing at a more respectable 1.4 percent. The major events for February are the Super Bowl, Valentine’s Day, and President’s Day.
Investors aren’t the only ones running for safety as the market tumbles and the economy wobbles.
Businesses, too, are indicating an unwillingness to take on risk as loan demand declined for the first time in about four years, according to the Federal Reserve’s Senior Loan Officer Survey released this week.
Demand for commercial and industrial loans has plunged in 2016, with declines happening across business sizes. Large- and medium-sized businesses had an 11.1 percent decline, while demand from small businesses fell 12.7 percent.
Maybe stocks aren’t buying the spin any more?


