Better than expected, but not enough to reverse this year’s downtrend, as per the chart, and housing is adding less to q2 gdp than it did to q1 gdp: Highlights Housing data have been up and down and are now back up as both housing starts and permits easily beat Econoday’s top estimates. Starts jumped 8.3 percent in June to a 1.215 million annualized rate with permits up 7.4 percent to a 1.254 million rate. As weak as the details were in the prior report is how strong they are in the latest. Looking at permits first, the single-family category rose 4.1 percent to an 811,000 rate with multi-family permits up 13.9 percent to 443,000. Permits are strongest in the Midwest followed by the West and South. Permits in the Northeast are the weakest. Starts for single-family homes
Topics:
WARREN MOSLER considers the following as important: Uncategorized
This could be interesting, too:
tom writes The Ukraine war and Europe’s deepening march of folly
Stavros Mavroudeas writes CfP of Marxist Macroeconomic Modelling workgroup – 18th WAPE Forum, Istanbul August 6-8, 2025
Lars Pålsson Syll writes The pretence-of-knowledge syndrome
Dean Baker writes Crypto and Donald Trump’s strategic baseball card reserve
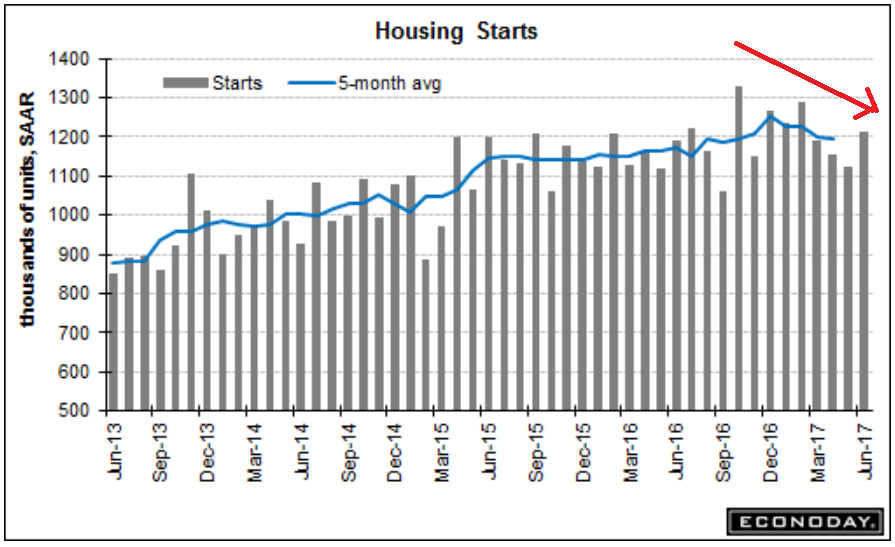
Better than expected, but not enough to reverse this year’s downtrend, as per the chart, and housing is adding less to q2 gdp than it did to q1 gdp:
Highlights
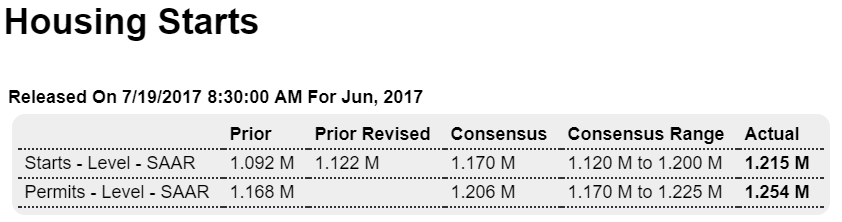
Housing data have been up and down and are now back up as both housing starts and permits easily beat Econoday’s top estimates. Starts jumped 8.3 percent in June to a 1.215 million annualized rate with permits up 7.4 percent to a 1.254 million rate.
As weak as the details were in the prior report is how strong they are in the latest. Looking at permits first, the single-family category rose 4.1 percent to an 811,000 rate with multi-family permits up 13.9 percent to 443,000. Permits are strongest in the Midwest followed by the West and South. Permits in the Northeast are the weakest.
Starts for single-family homes rose 6.3 percent in June’s report to 849,000 with multi-family up 13.3 percent to 366,000. Here the regional breakdown shows the Northeast out in front followed by the Midwest. Starts in the West are up slightly and are down noticeably in the South.
Completions offer further good news, up 5.2 percent overall to a 1.203 million rate led here by multi-family units. Homes under construction are unchanged at 1.070 million.
Despite June’s gains and in a negative for GDP, second-quarter rates are below those of the first quarter averaging 1.164 million for starts vs 1.238 million. Permits are also down, at 1.217 million vs 1.260 million.
Quarterly comparisons aside, this is a solid report that puts the housing sector back at the front of the economy. Watch next week for existing home sales and new home sales, both of which recovered in May after stumbling in April.
Lower highs and lower lows, as the 5 month moving average works its way lower: