Still depressed by historical standards, and still seem to me to be going sideways, as per the charts: Highlights Housing starts did fall 2.6 percent in January but the 1.246 million annualized rate is well above Econoday’s consensus for 1.232 million. Details show a 1.9 percent rise for single-family starts to a 823,000 rate, offset by a 10.2 percent decline in multi-family units to 423,000. Year-on-year, however, both components are very positive, up 6.2 percent for single-family homes and at a very strong 19.8 percent for multi-units. Permits rose 4.6 percent in January to a 1.285 million rate that also easily beat the consensus, for 1.233 million. But here single-family permits, which are very closely watched, fell 2.7 percent to a 808,000 rate that is still, however, 11.1 percent higher than a year ago. Multi-family permits jumped to 477,000 from a 398,000 rate but are up a relatively modest 3.5 percent from a year ago. This report is always volatile and bumpy from component to component but in sum, housing starts and permits are pointing to continuing strength for new homes where lack of supply held down what nevertheless was a solidly positive 2016 for the sector. More trumped up expectations? Highlights The strength of the Philadelphia Fed’s general business conditions index is impossible to exaggerate. February’s 43.3 is not a misprint.
Topics:
WARREN MOSLER considers the following as important: Uncategorized
This could be interesting, too:
tom writes The Ukraine war and Europe’s deepening march of folly
Stavros Mavroudeas writes CfP of Marxist Macroeconomic Modelling workgroup – 18th WAPE Forum, Istanbul August 6-8, 2025
Lars Pålsson Syll writes The pretence-of-knowledge syndrome
Dean Baker writes Crypto and Donald Trump’s strategic baseball card reserve
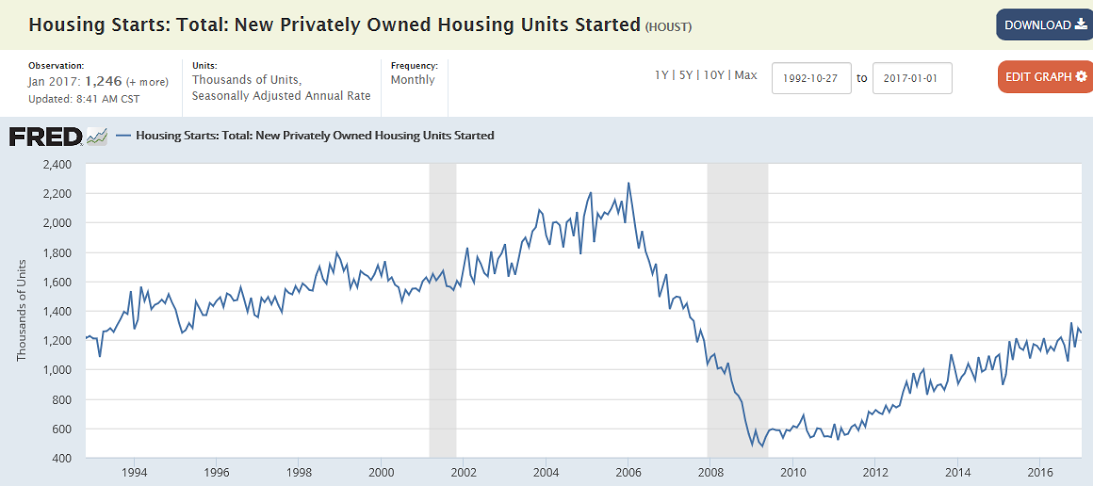
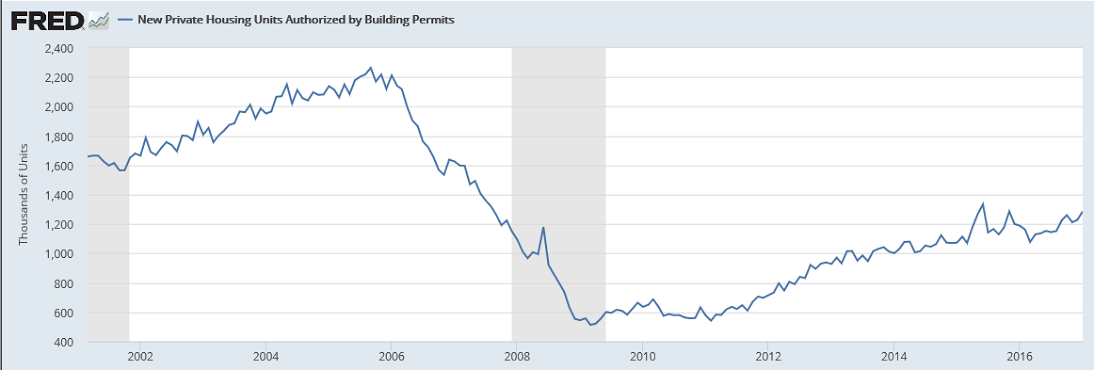
Still depressed by historical standards, and still seem to me to be going sideways, as per the charts:

Highlights
Housing starts did fall 2.6 percent in January but the 1.246 million annualized rate is well above Econoday’s consensus for 1.232 million. Details show a 1.9 percent rise for single-family starts to a 823,000 rate, offset by a 10.2 percent decline in multi-family units to 423,000. Year-on-year, however, both components are very positive, up 6.2 percent for single-family homes and at a very strong 19.8 percent for multi-units.
Permits rose 4.6 percent in January to a 1.285 million rate that also easily beat the consensus, for 1.233 million. But here single-family permits, which are very closely watched, fell 2.7 percent to a 808,000 rate that is still, however, 11.1 percent higher than a year ago. Multi-family permits jumped to 477,000 from a 398,000 rate but are up a relatively modest 3.5 percent from a year ago.
This report is always volatile and bumpy from component to component but in sum, housing starts and permits are pointing to continuing strength for new homes where lack of supply held down what nevertheless was a solidly positive 2016 for the sector.


More trumped up expectations?

Highlights
The strength of the Philadelphia Fed’s general business conditions index is impossible to exaggerate. February’s 43.3 is not a misprint. It’s the strongest since very far back, since January 1984. Yes, this index is a response to a single question on monthly sentiment but its enormous strength is confirmed by a very tangible reading, and that is the new orders index which jumped 12 points in the month to 38 which itself is a record or should be one if it is not.
Other readings in this report are less spectacular but very strong including a big build for backlogs, a healthy draw for inventories, understandable slowing in delivery times, and noticeable pressures in costs and positive traction for selling prices.
As an advance indicator, this report rivals the ISM manufacturing survey in importance. These readings point squarely at 2017 acceleration for a factory sector that limped through 2016.
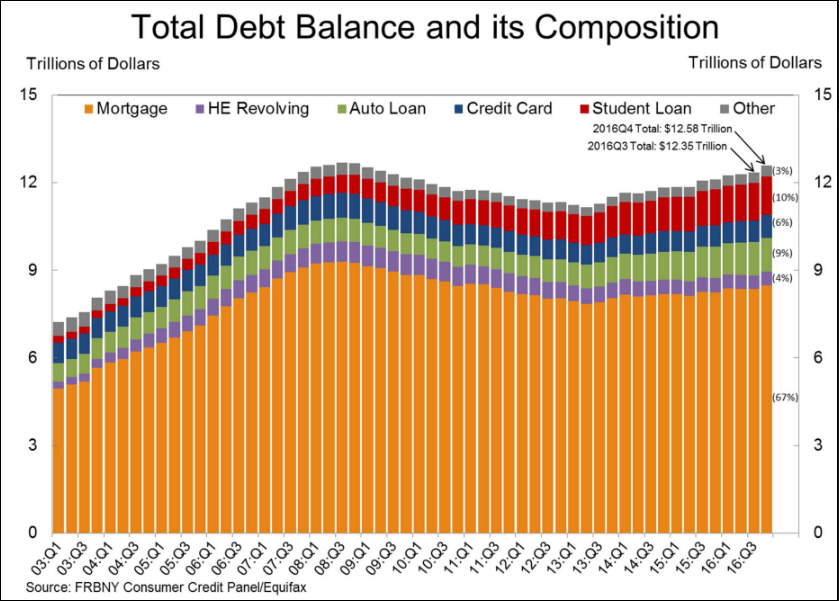
Not uncommon for a sudden surge of debt to come before a drop in spending, as consumers get caught short on the income side and borrow for a while as they transition to reduced spending:
From the NY Fed: Household Debt Increases Substantially, Approaching Previous Peak
The Federal Reserve Bank of New York today issued its Quarterly Report on Household Debt and Credit, which reported that total household debt increased substantially by $226 billion (a 1.8% increase) to $12.58 trillion during the fourth quarter of 2016. This marked the largest quarterly increase in total household debt since the fourth quarter of 2013, and debt today is now just 0.8% below its peak of $12.68 trillion reached in the third quarter of 2008. Every type of debt increased since the previous quarter, with a 1.6% increase in mortgage debt, 1.9% increase in auto loan balances, a 4.3% increase in credit card balances, and a 2.4% percent increase in student loan balances. This boost in balances was in part driven by new extensions of credit, with a large increase in the volume of mortgage originations and a continuation in the strong recent trend in auto loan originations. This report is based on data from the New York Fed’s Consumer Credit Panel, a nationally representative sample of individual- and household-level debt and credit records drawn from anonymized Equifax credit data.
…
Mortgage balances increased and mortgage originations reached the highest level seen since the beginning of the Great Recession.Mortgage delinquencies remained mostly unchanged and the delinquency transition rates for current mortgage accounts improved slightly.
New foreclosure notations reached another new low for the 18-year history of this series.
…
Overall delinquency rates were roughly stable this quarter.This quarter saw the lowest number of bankruptcy notations in the 18-year history of this series, continuing an overall downward trend since the financial crisis.
emphasis addedRead more at http://www.calculatedriskblog.com/#x5tyrtmlKLRi2SWM.99
You can see how it moved up into the crash of 08:

