Heading south in line with the deceleration of mortgage lending: Highlights Weakness in the South pulled down new home sales in August as it did in last week’s existing home sales report. New home sales fell sharply in the month to a 560,000 annualized rate vs an upward revised rate of 580,000 in July and a downward revised 614,000 in June (revisions total a net minus 7,000). Sales in the South, which is by far the largest region for housing, fell 4.7 percent in the month to a 307,000 rate for a year-on-year decline of 9.2 percent. But importantly, sales in the West and Northeast were also lower, down 2.6 and 2.7 percent respectively, with sales in the Midwest unchanged. September in fact was a weak month for housing demand, evident in this report’s median price which
Topics:
WARREN MOSLER considers the following as important: Uncategorized
This could be interesting, too:
tom writes The Ukraine war and Europe’s deepening march of folly
Stavros Mavroudeas writes CfP of Marxist Macroeconomic Modelling workgroup – 18th WAPE Forum, Istanbul August 6-8, 2025
Lars Pålsson Syll writes The pretence-of-knowledge syndrome
Dean Baker writes Crypto and Donald Trump’s strategic baseball card reserve
Heading south in line with the deceleration of mortgage lending:

Highlights
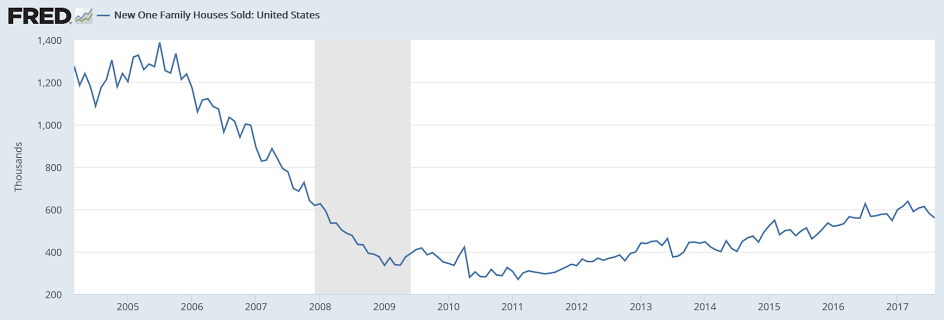
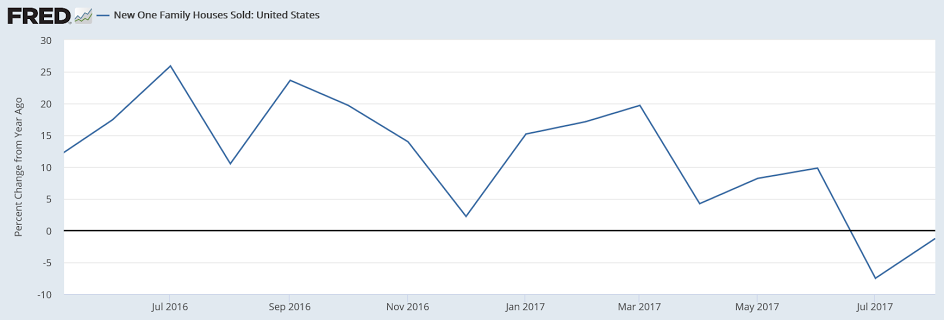
Weakness in the South pulled down new home sales in August as it did in last week’s existing home sales report. New home sales fell sharply in the month to a 560,000 annualized rate vs an upward revised rate of 580,000 in July and a downward revised 614,000 in June (revisions total a net minus 7,000).
Sales in the South, which is by far the largest region for housing, fell 4.7 percent in the month to a 307,000 rate for a year-on-year decline of 9.2 percent. But importantly, sales in the West and Northeast were also lower, down 2.6 and 2.7 percent respectively, with sales in the Midwest unchanged.
September in fact was a weak month for housing demand, evident in this report’s median price which fell a very sharp 6.2 percent to $300,200. Year-on-year, the median is up only 0.4 percent which, in another negative, is still ahead of sales where the yearly rate is minus 1.2 percent.
Builders, despite late month disruptions in the South, moved houses into the market, up 12,000 to 284,000 for a striking 17.8 percent yearly gain that hints at a glut. But supply had been so thin that the balance is now at a traditional level, at 6.1 months vs 5.7 and 5.3 months in the prior two months and 5.1 months a year ago.
Hurricane effects are likely in the next report for September with the South to continue to suffer. But today’s data do mark a shift, one of softening sales nationally, which is a short-term weakness, and a rebalancing in supply which is long-term strength. Yet for the 2017 economy, the housing sector looks to be ending the year in weakness, some of it hurricane related.
This isn’t looking so good either:

Highlights
Existing home sales have been on the decline as signaled all along by the pending home sales index which is down a very steep 2.6 percent in the latest reading which is for August. Hurricane Harvey’s late August hit on Texas didn’t help pending sales in the South which fell 3.5 percent but pending sales show across-the-board weakness: Northeast down 4.4 percent, Midwest down 1.5 percent, and the West down 1.0 percent.
Pending sales nationwide are down a year-on-year 2.6 percent while final sales of existing homes are down 1.7 percent. The pending index has been on a tailspin this year, peaking at 112.3 in February and now down at 106.3 for a year-to-date decline of 5.3 percent. New home sales, along with sales of existing homes, have also been moving lower making for a housing sector that is visibly stumbling into year end. The cause? It’s not mortgage rates which are very low nor employment which is very strong. High asking prices, however, are one factor as is soft wage growth.
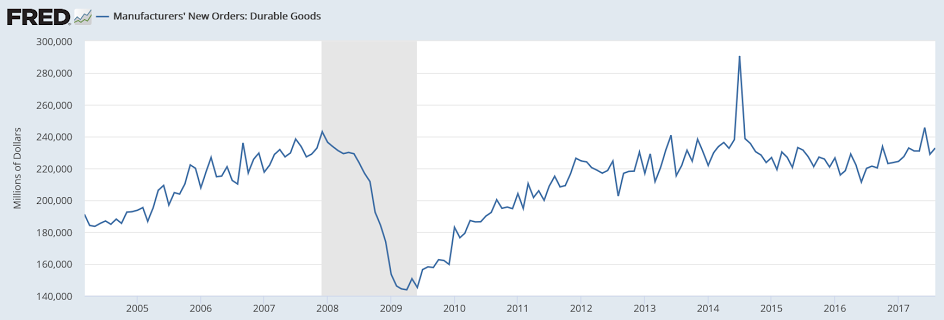
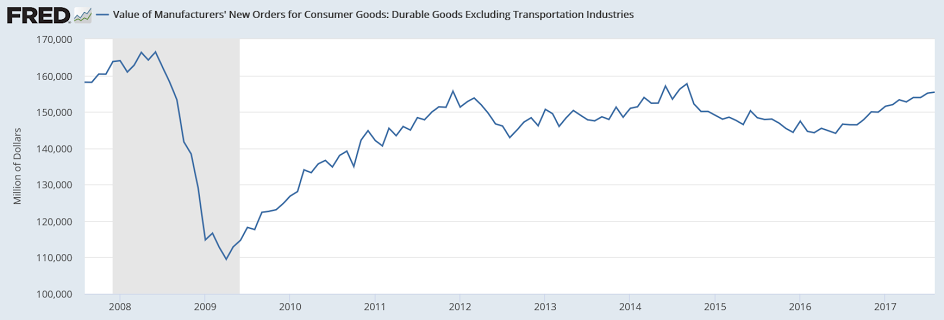
This type of thing went down hard after the collapse in oil capex in November 2014, And subsequently resumed growth a modest rates, as per the chart:
Highlights
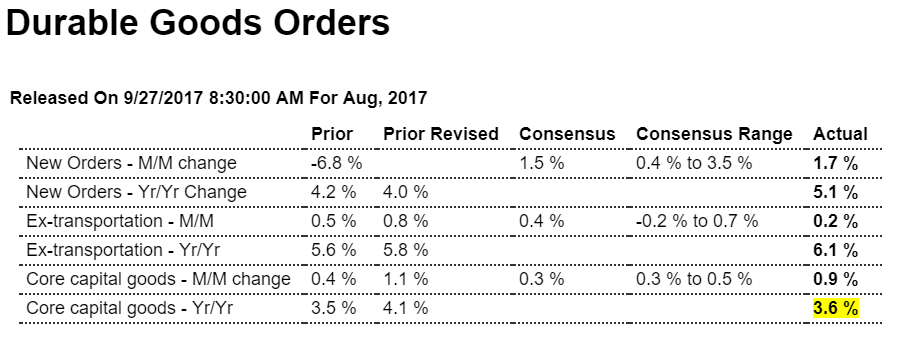
A second straight jump in capital goods leads what is a mostly very strong durable goods report where the August headline rose 1.7 percent. This is only slightly above expectations but not core capital goods (nondefense ex-aircraft) which jumped 0.9 percent vs Econoday’s consensus for a 0.3 percent gain. This together with a second straight jump in shipments of core capital goods, up 0.7 percent in August, point to business confidence and strengthening business investment and will significantly lift estimates for second-half nonresidential investment.
The headline gain reflects a monthly upswing in civilian aircraft orders, up 45 percent in August following a drop of 71 percent and a surge of 129 percent in the prior two months. Excluding transportation, the report’s strength fades, up only 0.2 percent which is half the expected gain. Weakness here is in defense capital goods which fell 9.4 percent but following July’s 15.3 percent jump. Other declines include fabricated metals (down 0.4 percent), computers (down 2.3 percent), and electrical equipment (down 0.1 percent).
But there’s more good news than bad news including motor vehicles which had been weakening but now show a 1.5 percent August gain for orders and a 1.9 percent rise in shipments. Communications equipment also jumped with orders up 4.0 percent. Other readings include a moderate 0.3 percent rise for both total shipments and inventories that keeps the inventory-to-shipments ratio steady at a lean and constructive 1.69. Unfilled orders did not show improvement, unchanged following July’s 0.3 percent decline.
The factory sector did not show any initial effects from Hurricane Harvey’s late August hit and, assuming Hurricane Irma’s effects proves as slight in September, appears poised for solid year-end acceleration centered in capital goods. The one missing piece in the factory sector, however, is manufacturing production as measured by the Federal Reserve which has remained stubbornly weak including a 0.3 percent fall in the report for August. Note that revisions in today’s report are minor compared to the factory orders report when capital goods data from the July advance durables report were sharply upgraded.
A bit of a fallacy of composition here? (who’s supposed to care for the retired?)
We’ve set up our institutional structure to eliminate our species?
;)

