Summary:
Tyler Durden at ZeroHedge, and others, are discussing Bill Gross's recent rant on his monthly letter to investors about the yield curve and the possibility of a Trump recession. Bill Gross sees in the decline of the 10-year bond rate since the early 1980s a secular (like Summers and his secular stagnation, it seems everything is secular now) trend, and concludes that the long term rate cannot go above 2.6% or so. In his words: "So for 10-year Treasuries, a multiple of influences obscure a rational conclusion that yields must inevitably move higher during Trump's first year in office. When the fundamentals are confusing, however, technical indicators may come to the rescue and it's there where a super three decade downward sloping trend line for 10-year yields could be critical. Shown in the chart below, it's obvious to most observers that 10-year yields have been moving downward since their secular peak in the early 1980s, and at a rather linear rate. 30 basis point declines on average for the past 30 years have lowered the 10-year from 10% in 1987 to the current 2.40%... And this is my only forecast for the 10-year in 2017. If 2.60% is broken on the upside – if yields move higher than 2.60% – a secular bear bond market has begun.
Topics:
Matias Vernengo considers the following as important: Durden, Gross, Trumponomics, yield curve
This could be interesting, too:
Matias Vernengo writes The second coming of Trumponomics
Matias Vernengo writes More on the possibility and risks of a recession
Matias Vernengo writes Trumponomics vs. Bidenomics: The good, the bad and the stupid
NewDealdemocrat writes The “bearish steepening” and the death of refinancing
Tyler Durden at ZeroHedge, and others, are discussing Bill Gross's recent rant on his monthly letter to investors about the yield curve and the possibility of a Trump recession. Bill Gross sees in the decline of the 10-year bond rate since the early 1980s a secular (like Summers and his secular stagnation, it seems everything is secular now) trend, and concludes that the long term rate cannot go above 2.6% or so. In his words:
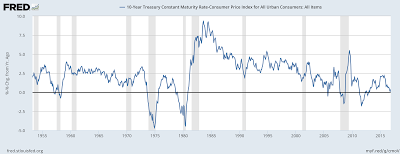
There is nothing secular about the falling rate long or short term rate, however, which Gross analyzes in nominal terms. The declining tendency is just the result of the lower rates of inflation, what Bernanke called the Great Moderation, even if the causes are not the ones he suggested. Sure enough, in real terms, the 10-year treasuries are also down, but I cannot see a trend.
What I suspect is going on in the graph above are three different phases, in which the long term rate has fluctuated around different levels. During the Golden Age (50s through 70s) the rate was relatively low, a result of tight regulation, and extensive capital controls, which allowed low rates at home. After the Great Inflation, with negative rates, and the Carter/Reagan/Clinton deregulation rates were considerably higher. What we observe in the 2000s is that after several bubble-led booms, nominal rates have been forced to the floor. But there is no secular trend associated to this, it is the result of policy choices given the macro and regulatory regime we have.
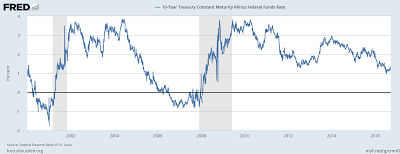
"So for 10-year Treasuries, a multiple of influences obscure a rational conclusion that yields must inevitably move higher during Trump's first year in office. When the fundamentals are confusing, however, technical indicators may come to the rescue and it's there where a super three decade downward sloping trend line for 10-year yields could be critical. Shown in the chart below, it's obvious to most observers that 10-year yields have been moving downward since their secular peak in the early 1980s, and at a rather linear rate. 30 basis point declines on average for the past 30 years have lowered the 10-year from 10% in 1987 to the current 2.40%... And this is my only forecast for the 10-year in 2017. If 2.60% is broken on the upside – if yields move higher than 2.60% – a secular bear bond market has begun."The fear is, of course, that if the Fed continues to tighten monetary policy, then the yield curve (the difference between the long term rate and the base rate) would be inverted (see figure) and a recession would follow.
There is nothing secular about the falling rate long or short term rate, however, which Gross analyzes in nominal terms. The declining tendency is just the result of the lower rates of inflation, what Bernanke called the Great Moderation, even if the causes are not the ones he suggested. Sure enough, in real terms, the 10-year treasuries are also down, but I cannot see a trend.
What I suspect is going on in the graph above are three different phases, in which the long term rate has fluctuated around different levels. During the Golden Age (50s through 70s) the rate was relatively low, a result of tight regulation, and extensive capital controls, which allowed low rates at home. After the Great Inflation, with negative rates, and the Carter/Reagan/Clinton deregulation rates were considerably higher. What we observe in the 2000s is that after several bubble-led booms, nominal rates have been forced to the floor. But there is no secular trend associated to this, it is the result of policy choices given the macro and regulatory regime we have.
It's is perfectly possible, if Trump really promotes a fiscal expansion, that the base rate would rise, and the long rate too, keeping a positive yield curve, and a higher average real 10-year bond rate. Above 2.6% for sure. Not saying it will happen. Just that it is plausible, and there is no secular trend that precludes it.


