In the last piece on detecting housing market bubbles, I an through some of the problems with using standard-scoring. Here I will provide two solutions; one complex, the other simple. But before we move forward with this, we must understand one other problem when it comes to determining whether a housing bubble is indeed a housing bubble. This problem is not, like standard-scoring, related to how we manipulate the data. Rather it is related to how we define a housing bubble itself. The best way to approach this is to give examples. Below I show two very different real house price series; one from Norway, the other from Ireland. Here we see two series with two very different properties. The Norway series shows steady, upward growth in real house prices over the past 30 years.
Topics:
Philip Pilkington considers the following as important: Uncategorized
This could be interesting, too:
tom writes The Ukraine war and Europe’s deepening march of folly
Stavros Mavroudeas writes CfP of Marxist Macroeconomic Modelling workgroup – 18th WAPE Forum, Istanbul August 6-8, 2025
Lars Pålsson Syll writes The pretence-of-knowledge syndrome
Dean Baker writes Crypto and Donald Trump’s strategic baseball card reserve
In the last piece on detecting housing market bubbles, I an through some of the problems with using standard-scoring. Here I will provide two solutions; one complex, the other simple. But before we move forward with this, we must understand one other problem when it comes to determining whether a housing bubble is indeed a housing bubble.
This problem is not, like standard-scoring, related to how we manipulate the data. Rather it is related to how we define a housing bubble itself. The best way to approach this is to give examples. Below I show two very different real house price series; one from Norway, the other from Ireland.


Here we see two series with two very different properties. The Norway series shows steady, upward growth in real house prices over the past 30 years. Whereas, the Irish series shows a boom, a bust and another boom.
Are we implying that if a series behaves like Norway then it is not a bubble? Not necessarily. It could easily be a bubble that has not burst yet – after all, our a priori assumption should be that house price growth should largely track inflation and so real house prices should be largely stable. But there could be reasons why real house prices rise in a certain country that is not due to a bubble.
Norway is an excellent example of this, because it has large oil reserves. These reserves render the population more and more wealthy through time, even if they do not increase their productive capacities. This could, in theory, result in ever increasing real house prices. Does this mean that Norway is definitely not experiencing a housing bubble over the past 30 years? No. But it provides a reasonable explanation for why they might not be.
Seeing a stable linear trend in real house prices over a long time horizon then, reduces our confidence that this trend is the result of a bubble. We can be fairly confident that rising Irish home prices are bubbly because we’ve seen this movie before in Ireland – hence the jagged data series. But when it comes to a country like Norway we cannot be nearly as sure.
The reader will probably have noticed that I included R-squared statistics in each chart. This is because we can use this statistic to get a sense of how tightly linear a series is. If we see an R-squared of 0.8 or over in a country’s real house price index, this makes us less confidence that rising real home prices are a bubble. This gives us one variable for our model.
But now we have to solve the problem with standard-scoring we explored last time. We can do this by taking our base from a point at which the series was stable. Typically when standard-scoring we use the mean and the variance of the entire series. But if this is throwing the results off, when can choose a more stable base. Unfortunately, this will give us statistics that are impossible to interpret in terms of actual standard deviation, but they will work much better when trying to detect worringly elevated real house prices.
Combing through the series, I found that the most universally stable base was between 1993 and 1996. This was after the Japanese and Swedish bubbles had deflated and before the infamous 2008 bubbles started to inflate in the late-1990s.
We can then assign a points system to determine whether there is a housing bubble in a given country. Because elevated prices are more important than linear trend, we will give this priority. Therefore we will assign two possible points on the basis of elevated prices. One point is assigned if the Z-score is higher than 20; the other if it is higher than 35. An additional point is assigned if the R-squared of the series in below 80 – this gives a point for a lack of linearity.
Here are the results (full results in the appendix).
| IRL | 3 |
| USA | 3 |
| ZAF | 3 |
| AUS | 2 |
| CAN | 2 |
| DEU | 2 |
| EA17 | 2 |
| ESP | 2 |
| FIN | 2 |
| FRA | 2 |
| GBR | 2 |
| SWE | 2 |
| BEL | 1 |
| CHE | 1 |
| ITA | 1 |
| JPN | 1 |
| KOR | 1 |
| NLD | 1 |
| NOR | 1 |
| PRT | 1 |
| DNK | 0 |
Is there a simple number that tells us of a definite bubble? No. But if we accept our premises then the higher the score, the more likely that country is to be in a bubble.
So, the $64m question: are the world’s property markets bubbly right now? Based on our model we would say: yes. Of the 21 countries/regions under scrutiny, 12 have achieved a score of 2 or over – with 3 achieving a perfect score of 3. Only 9, by contrast, had 1 or less – and only 1 had a score of 0.
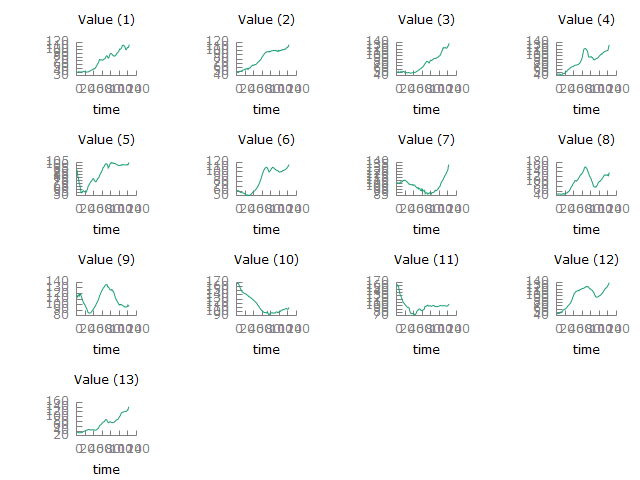
Finally, we would note a much simpler way to detect bubbles: by eyeballing the time series and making a judgement on whether or not it looks like a bubble or not. In the vein, we present the time-tested and much underappreciated practice of… just looking closely at panel data. (Varible codes below panels).

1 = ‘AUS’
2 = ‘BEL’
3 = ‘CAN’
4 = ‘DNK’
5 = ‘FIN’
6 = ‘FRA’
7 = ‘DEU’
8 = ‘IRL’
9 = ‘ITA’
10 = ‘JPN’
11 = ‘KOR’
12 = ‘NLD’
13 = ‘NZL’
14 = ‘NOR’
15 = ‘PRT’
16 = ‘ESP’
17 = ‘SWE’
18 = ‘CHE’
19 = ‘GBR’
20 = ‘USA’
21 = ‘COL’
22 = ‘ZAF’
23 = ‘EA’
24 = ‘EA17’
25 = ‘OECD’
Appendix
Full results.
| Zscr-93-96Base | RSQ | Z>20 | Z>35 | RSQ<80 | Bubble Score | ||||
| AUS | 150.9 | 0.95 | 1 | 1 | 0 | 2 | |||
| BEL | 32.2 | 0.94 | 1 | 0 | 0 | 1 | |||
| CAN | 53.8 | 0.89 | 1 | 1 | 0 | 2 | |||
| CHE | 12.2 | 0.46 | 0 | 0 | 1 | 1 | |||
| DEU | 21.3 | 0.01 | 1 | 0 | 1 | 2 | |||
| DNK | 19.6 | 0.80 | 0 | 0 | 0 | 0 | |||
| EA17 | 28.0 | 0.71 | 1 | 0 | 1 | 2 | |||
| ESP | 34.3 | 0.32 | 1 | 0 | 1 | 2 | |||
| FIN | 26.7 | 0.74 | 1 | 0 | 1 | 2 | |||
| FRA | 30.2 | 0.80 | 1 | 0 | 1 | 2 | |||
| GBR | 141.1 | 0.84 | 1 | 1 | 0 | 2 | |||
| IRL | 38.8 | 0.43 | 1 | 1 | 1 | 3 | |||
| ITA | -0.4 | 0.00 | 0 | 0 | 1 | 1 | |||
| JPN | -10.1 | 0.72 | 0 | 0 | 1 | 1 | |||
| KOR | -0.3 | 0.09 | 0 | 0 | 1 | 1 | |||
| NLD | 16.2 | 0.60 | 0 | 0 | 1 | 1 | |||
| NOR | 28.6 | 0.98 | 1 | 0 | 0 | 1 | |||
| PRT | 6.6 | 0.16 | 0 | 0 | 1 | 1 | |||
| SWE | 165.3 | 0.93 | 1 | 1 | 0 | 2 | |||
| USA | 88.2 | 0.61 | 1 | 1 | 1 | 3 | |||
| ZAF | 56.6 | 0.70 | 1 | 1 | 1 | 3 |