This article first appeared in the Indian journal Economic and Political Weekly on 17 July, 2021. First, let me answer the question in the title: I do not know because, according to conventional theories, when the realised and expected inflation rates are as high as they are in the United States (US), the long-term US Treasury yields should go up. Although the realised and expected inflation rates have been going up since April 2021, the long-term US Treasury yields, however, have not been rising. Not only that, but they have started falling. We see this from Figure 1, which is the daily graph of the 10-year US Treasury yield from 2 January 2020 to 9 July 2021. The 10-year yield is the most important of the long-term US Treasury yields since it is a vital financial benchmark. It
Topics:
T. Sabri Öncü considers the following as important: Article, Finance & Regulation
This could be interesting, too:
Jeremy Smith writes UK workers’ pay over 6 years – just about keeping up with inflation (but one sector does much better…)
T. Sabri Öncü writes Argentina’s Economic Shock Therapy: Assessing the Impact of Milei’s Austerity Policies and the Road Ahead
T. Sabri Öncü writes The Poverty of Neo-liberal Economics: Lessons from Türkiye’s ‘Unorthodox’ Central Banking Experiment
Ann Pettifor writes Global Economic Governance: What’s “Growth” Got to Do with It?
This article first appeared in the Indian journal Economic and Political Weekly on 17 July, 2021.
First, let me answer the question in the title: I do not know because, according to conventional theories, when the realised and expected inflation rates are as high as they are in the United States (US), the long-term US Treasury yields should go up.
Although the realised and expected inflation rates have been going up since April 2021, the long-term US Treasury yields, however, have not been rising. Not only that, but they have started falling. We see this from Figure 1, which is the daily graph of the 10-year US Treasury yield from 2 January 2020 to 9 July 2021.
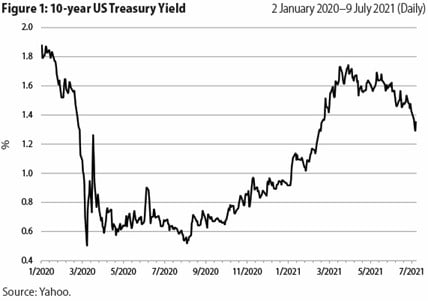
The 10-year yield is the most important of the long-term US Treasury yields since it is a vital financial benchmark. It influences the mortgage and corporate borrowing interest rates, as well as the stock market. It is like a barometer that measures the health of the US economy, if not that of the world economy.
Of course, one should not conclude from this that the 10-year US Treasury yield is the only device to measure the health of the US or the world economy. It is just one device among many, and since it sometimes goes up and sometimes down, one cannot say much about the economy’s health simply by looking at this variable. However, it sometimes falls precipitously, and when that happens, it usually, if not always, is a sign of financial or economic distress or both.
Data Tantrum
Data tantrum is a term the chief economist of the Institute of International Finance (IIF), Robin Brooks, coined in a tweet on 28 February 2021. He started to develop the concept in a tweet on 8 January 2021,1 and, after several related tweets, he defined it as follows: 2
The 2013 taper tantrum was a hawkish Fed shift that surprised markets. 2021 will be a “data” tantrum, when GDP rebounds as the economy reopens.
Fed is the central bank of the US, GDP means the gross domestic product or gross domestic income, and I will describe the 2013 taper tantrum later.
A relatively more precise definition came from the IIF on 2 July 2021, also in a tweet:3
Earlier this year we coined the term “data tantrum” to describe the unprecedented reopening of the US economy, which we thought consensus would have a hard time forecasting.
Another recent definition came from the governor of the South African Reserve Bank, Lesetja Kganyago, on 27 June 2021, when he told the Financial Times the following:4
We shouldn’t worry about a taper tantrum. We could worry about a data tantrum, or investors reading too much into the latest economic data as a signal of imminent rate rises.
Putting all of these together, I define the data tantrum as investors (Brooks?) reading too much into the latest economic data as a signal of imminent long-term US Treasury yields rises.
Quantitative Easing
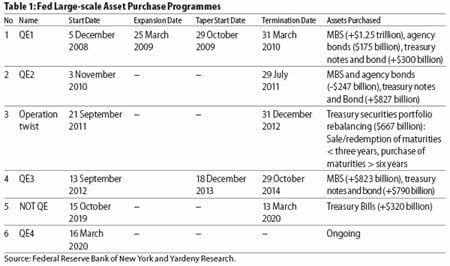
The Fed large-scale asset purchase programmes, commonly referred to as “quantitative easing (QE)” programmes or, for short, QEs, started on 25 November 2008 and since then, there have been five such programmes, the last of which is still ongoing. German economist Richard Werner coined the term quantitative easing in 1995 during the Japanese financial crisis of the 1990s.5 And on 19 March 2001, the Bank of Japan started a large-scale asset purchase programme, which lasted until 2006. This is the first large-scale asset purchase programme officially referred to as a QE.
In a speech on 13 January 2009, the then chairman of the Fed, Ben Bernanke described the difference between the Bank of Japan and Fed QEs as follows:6
Our approach—which could be described as “credit easing”—resembles quantitative easing in one respect: It involves an expansion of the central bank’s balance sheet. However, in a pure QE regime, the focus of policy is the quantity of bank reserves, which are liabilities of the central bank; the composition of loans and securities on the asset side of the central bank’s balance sheet is incidental … In contrast, the Federal Reserve’s credit easing approach focuses on the mix of loans and securities that it holds and on how this composition of assets affects credit conditions for households and businesses.
Although Bernanke made several other attempts to call the Fed large-scale asset purchase programmes “credit easing” programmes, it did not fly, and the rest of the world continued to call these programmes the QEs.
Table 1 lists the Fed’s large-scale asset purchase programmes (MBS appearing in the table stands for mortgage backed securities), while Figure 2 depicts the expansion of the Fed Balance Sheet since the Global Financial Crisis (GFC) that started on 9 August 2007 and became global on 15 September 2008.7 Figure 2 also shows how the 10-year US Treasury yield has evolved as the Fed balance sheet has expanded. Note that although the Operation Twist is not exactly a large-scale asset purchase programme as it actually is a portfolio rebalancing, I included it in Table 1 for convenience. So, the Fed large-scale asset purchase programmes since the onset of the GFC are the remaining five.
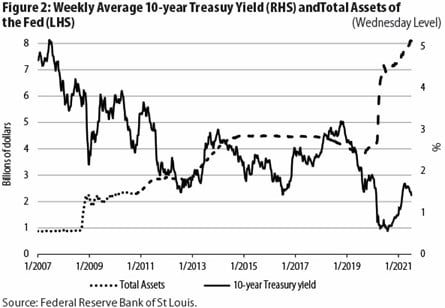
In the two major crisis episodes, namely the GFC (September 2008) and the COVID-19 crisis (March 2020), the immediate response of the Fed was not to start a QE but to create several lending facilities to provide liquidity to the distressed financial (and even some non-financial) institutions. The September 2008 and March 2020 jumps in the Fed total assets in Figure 2 correspond to the credit extended through these lending facilities. Then the QE programmes came and replaced these lending facilities, in the case of the GFC, in about three months, whereas in the case of the COVID-19 crisis, in about a week, way before the credit extension ended, possibly because the Fed was more experienced then.
It appears from Figure 2 that the immediate liquidity provision through these lending facilities stopped the free fall in the 10-year Treasury yield. When combined with Table 1, it also appears from Figure 2 that, contrary to what is commonly believed, the 10-year Treasury yield had not gone down but gone up during four of the five large-scale asset purchase programmes, at least, until a tapering started if there was one. The exception is the ongoing programme, and it is the reason for this article.
2013 Taper Tantrum
Now, I can turn my attention to the 2013 taper tantrum. Taper tantrum is the nickname of the phenomenon during which the long-term US Treasury yields rose, and the capital flew out of the emerging market (EM) economies in the third episode of these large-scale asset purchase programmes, that is, QE3.
Rumour had it that some Fed policymakers, including the current Fed Chairman Powell, argued in their 30 April–1 May 2013 Policy Meeting that the Fed should take “the next reasonable and plausible opportunity to taper” for the first time.8 This remained private for a few weeks, until the release of the minutes. But the belief is that the tantrum started with the testimony of Bernanke before the Joint Economic Committee of the US Congress on 22 May 2013, which became public immediately. Answering a question of a lawmaker, Bernanke said:9
If we see continued improvement and we have confidence that that is going to be sustained, then we could in the next few meetings, take a step down in our pace of purchases.
Shortly afterward, a capital exodus from the EM economies started. However, neither the US equity market nor the US real estate market suffered from this taper-talk, as evidenced by the Standard and Poor’s (S&P) 500 and S&P/Case–Shiller indexes. That is, other risk assets remained intact. Furthermore, as seen from Figure 2, the 10-year Treasury yield started to rise on 2 May 2013 after a dip on 1 May 2013, three weeks before Bernanke’s 22 May testimony. So, maybe, there were other economic reasons or what some Fed policymakers said in their 30 April–1 May 2013 policy meeting leaked, who knows?
Two other observations. First, combining Table 1 and Figure 2, it appears that after the actual tapering started in QE1 and QE3, the 10-year US Treasury yield had not gone up but gone down. Second, and more importantly, when the market interpreted the most recent Fed policy meeting—the one on 15–16 June 2021, whose statement and minutes released on 16 June and 7 July, respectively—as taper-talk, the 10-year Treasury yield had fallen precipitously, only to recover some on 9 July 2021. Not only that, violating conventional theories, capital had flown out of most EM countries despite this fall. But, this is another story.
Therefore, although the consensus is that Bernanke’s 22 May taper-talk was the trigger of the rise of the 10-year Treasury yield in the summer of 2013, it is a hypothesis that needs testing.
Data Tantrum and the RRP
The RRP is so technical that describing it even in layperson’s words would take many pages. RRP stands for reverse repurchase agreement or, for short, reverse repo, a form of collateralised lending. Furthermore, every reverse repo is a repo. The perspective depends on who is the lender and who is the borrower.
When the Fed does a repo with its reverse repo counterparties consisting of depository institutions (basically banks), money market mutual funds and several others, the Fed records this on its balance sheet as a reverse repo liability.
First, this drains reserves, that is, deposits of the depository institutions at the Fed, through which they pay each other. Second, this reduces deposits of non-depository rest at the depository institutions if the reverse repo counterparty of the Fed is a non-depository institution, resulting in money supply contraction whose impact on the economy is hardly pleasant. The less money there is to spend, the harder life is.
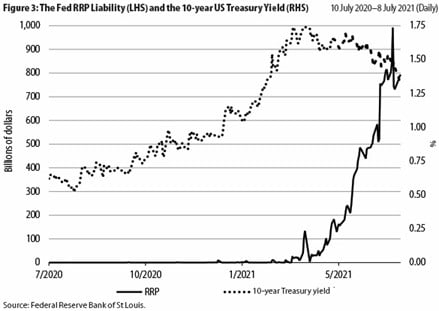
Although the data tantrum of QE4 Brooks defined on 28 February 2021 proceeded in the first quarter of 2021 as expected, that is, the long-term Treasury yields had risen and capital left most EM countries as the realised and expected inflation rates had risen in the US, the picture changed in the second quarter for no obvious reason. What is interesting is that, as seen from Figure 3, this change occurred when the RRP liabilities of the Fed started to build up in early April. Whether there can be a relationship between the two is a difficult question to answer now.
Conclusions
These are very uncertain times. And, as I usually do when times are this uncertain, let me conclude with quoting the following from my favourite song, La Sagrada Familia, of the Gaudi album by Alan Parsons Project:
“Who knows where the road may lead us
Only a fool would say”
The author, T. Sabri Öncü ([email protected]) is an economist based in Turkey.
Notes
1 https://twitter.com/RobinBrooksIIF/status/1347598844658380802.
2 https://twitter.com/RobinBrooksIIF/status/1366053091594895363.
3 https://twitter.com/IIF/status/1410988370818441219.
4 https://www.ft.com/content/8727900b-8499-4894-823f-8f453497e28d.
5 https://professorwerner.org/.
6 https://www.federalreserve.gov/newsevents/speech/bernanke20090113a.htm.
7 9 August 2007 is the day on which BNP Paribas suspended withdrawals from its three special investment vehicles when a bank run on them ensued, and 15 September 2008 is the day on which Lehman Brothers collapsed.
8 https://www.reuters.com/article/us-usa-fed-2013-timeline-idUSKCN1P52A8.
9 https://www.reuters.com/article/us-usa-fed-idUSBRE94L0JS20130522.