Corporate profits have received much more scrutiny in recent years. High inflation provoked on-going debates about the role of profit margins with terms like “greedflation” and “price gouging” levelled at corporations. People recognized that, at minimum, corporations are profiting from inflation. Analysis of 4,550 publicly-listed corporations found that 33% had record operating profits in 2021 or 2022.[1] Further, corporations with pricing power were found to be actively worsening inflation by hiking their profit margins. The corporate defence is that they are just passing along higher costs. However, during the Parliamentary testimony of Canada’s grocery CEOs, Loblaw’s then-CEO, and still Chairman, Galen Weston offered a general defence of corporate profits to justify the record
Topics:
DT Cochrane considers the following as important: Corporations, inequality, inflation, investment, profits, Uncategorized
This could be interesting, too:
tom writes The Ukraine war and Europe’s deepening march of folly
Jeremy Smith writes UK workers’ pay over 6 years – just about keeping up with inflation (but one sector does much better…)
Stavros Mavroudeas writes CfP of Marxist Macroeconomic Modelling workgroup – 18th WAPE Forum, Istanbul August 6-8, 2025
Lars Pålsson Syll writes The pretence-of-knowledge syndrome
Corporate profits have received much more scrutiny in recent years. High inflation provoked on-going debates about the role of profit margins with terms like “greedflation” and “price gouging” levelled at corporations. People recognized that, at minimum, corporations are profiting from inflation. Analysis of 4,550 publicly-listed corporations found that 33% had record operating profits in 2021 or 2022.[1] Further, corporations with pricing power were found to be actively worsening inflation by hiking their profit margins.
The corporate defence is that they are just passing along higher costs. However, during the Parliamentary testimony of Canada’s grocery CEOs, Loblaw’s then-CEO, and still Chairman, Galen Weston offered a general defence of corporate profits to justify the record profits that his company was collecting: “Over $2 billion is going to be reinvested back into this country. It’s not just about profit. It doesn’t go to me. It goes back into this country.”
This raises the question of how much corporate profit gets reinvested.
Let’s set aside the issue of whether corporations are the right decision-makers on the investments that would best serve the public. Let’s just follow the money to identify what publicly-listed, Canadian-headquartered corporations have been doing with their profits.
What are profits?
Profits are the difference between revenue and costs. However, there are several financial measures that can reasonably be called “profits”.
First, there are “gross profits”. This is revenue minus cost-of-goods-sold, which are the expenses for material and labour inputs to production.
Next, there are “operating profits”. This subtracts additional operating expenses, such as marketing or administration, from gross profits. Operating profits also get called EBITDA, which stands for “earnings before interest, taxes, depreciation, and amortization”.
Third, “pre-tax profits” or “pre-tax income”, are after deducting interest, depreciation, and amortization, but can also include the addition or subtraction of non-operating income and expenses.
Finally, “after-tax profits” or “net income”, are after deduction of corporate income taxes (CIT). This is the actual “bottom line”.
There are legitimate reasons to use different measures of profit depending on the analysis. For example, financial analysts often use EBITDA because it gives a better picture of a company’s cash flow from core operations.
The analysis that follows will focus on how operating profits have been distributed. This is the highest level of profit that can be consistently analyzed over several decades using the chosen data source. Unfortunately, until recently, many companies did not report the cost-of-goods sold separately from other operating expenses. Operating profits tend to be less volatile that pre-tax or net income and serve as a useful denominator to assess how profits are being used.
Operating Profit Margins
The profit margin measures a firm’s profits as a share of revenue. In other words, it expresses how much of the revenue is being claimed as profit.
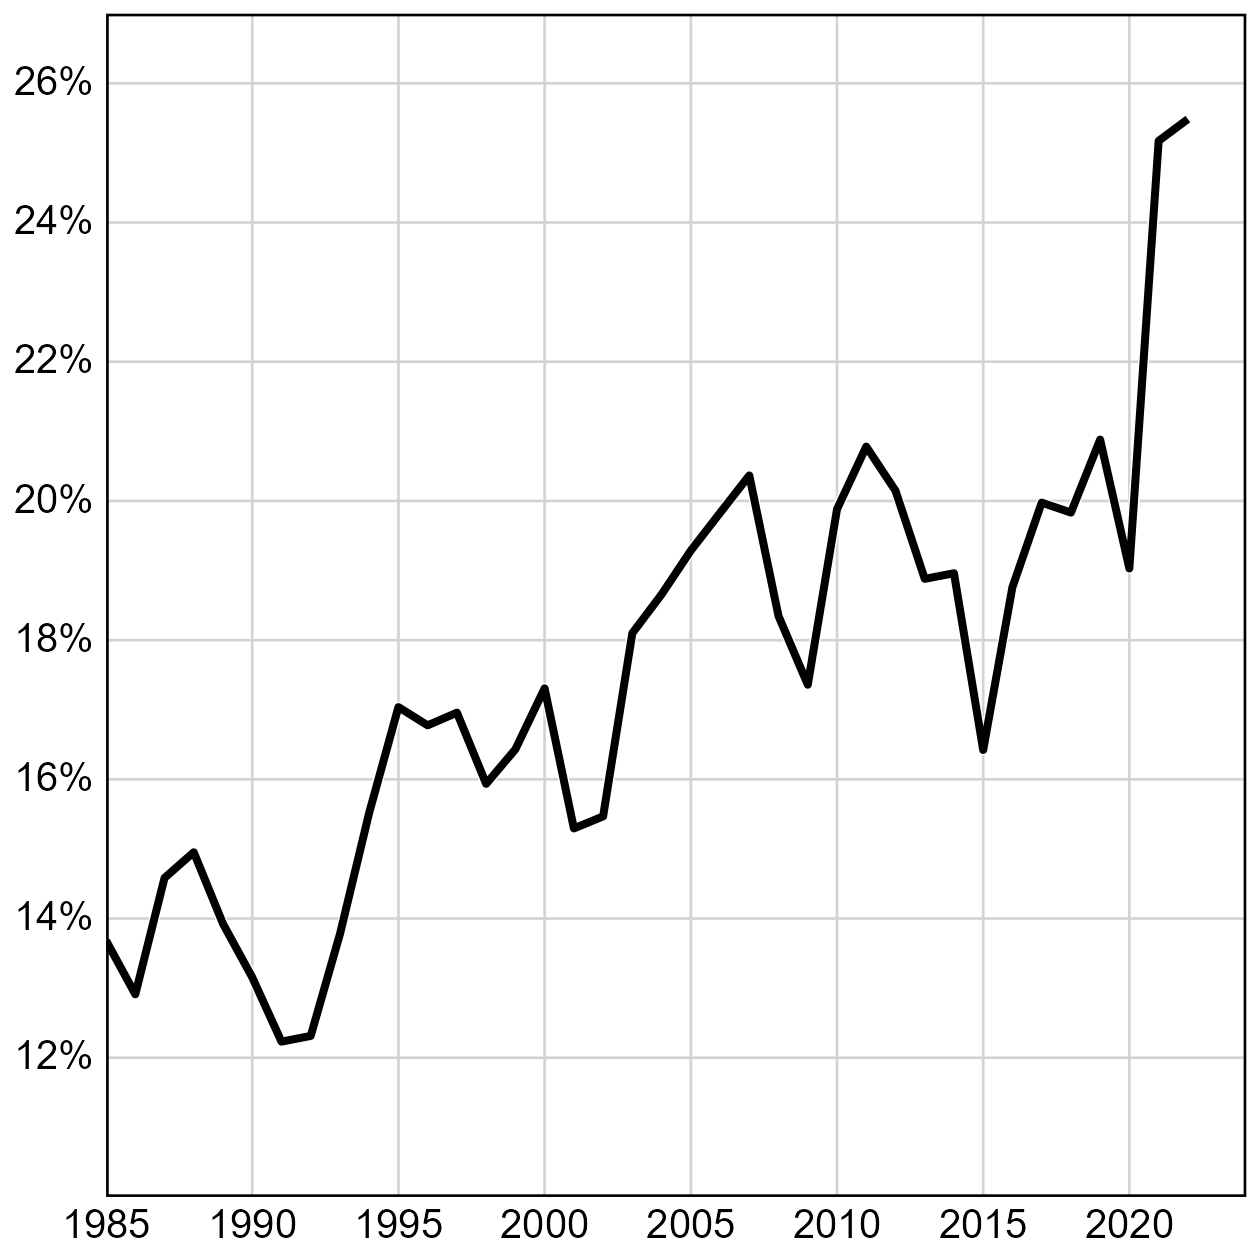
Figure 1 shows that Canadian corporate profits trended upward through the 1990s and early-2000s. The Global Financial Crisis of 2008/9, as well as the crash of commodity prices in 2015, significantly interrupted the upward trend. From 2006 to 2019, the profit margin averaged 19.5%, with a high in 2019 of 21.2%. After a modest dip in 2020, the margin jumped above 25% in 2021 and 2022.
Figure 1: Canadian Corporate Profit Margins, 1985-2022
Interest and Tax Expenses
Corporate income taxes and interest are two of the unavoidable expenses that corporations must cover out of operating profits. Interest expenses fluctuate with debt levels and interest rates. Tax expenses fluctuate with tax rates and the amount of tax avoidance companies engage in.
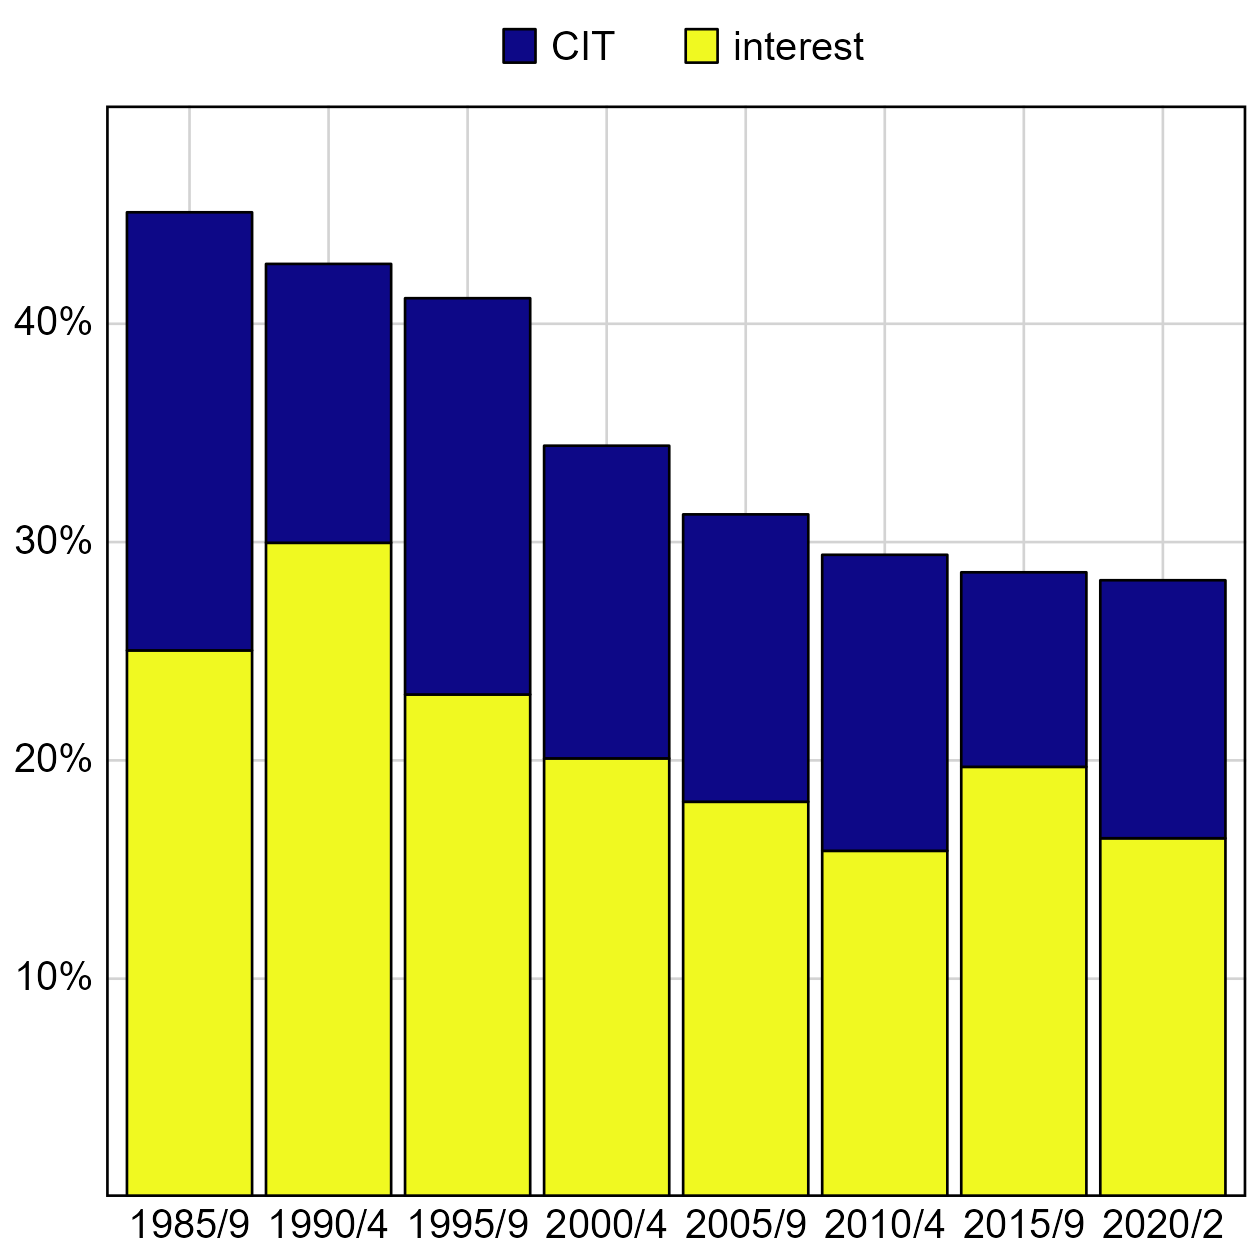
As seen in figure 2, the share of operating profits going to interest and taxes has been trending down since the late-1980s, when these costs claimed more than 45% of operating profits. Since 2020, to cover interest and taxes required less than 29%.[2] This means more of the operating profits were left for other uses, including to fund investment.
Figure 2: Interest & CIT Expenses
Investment and Distribution to Owners
In addition to extolling corporate profits as a source of investments, Galen Weston also offered the excuse that Loblaw’s profits do not go to him personally. This is very disingenuous. The Weston family owns about 25% of Loblaw and one of the key uses of corporate profits is to fund dividends and share buybacks, which go to shareholders.
Let’s compare how much of the remaining operating profits—after interest and tax expenses—is invested and how much gets distributed to owners. For this analysis, investment is defined as expenditures on physical assets less depreciation.[3]
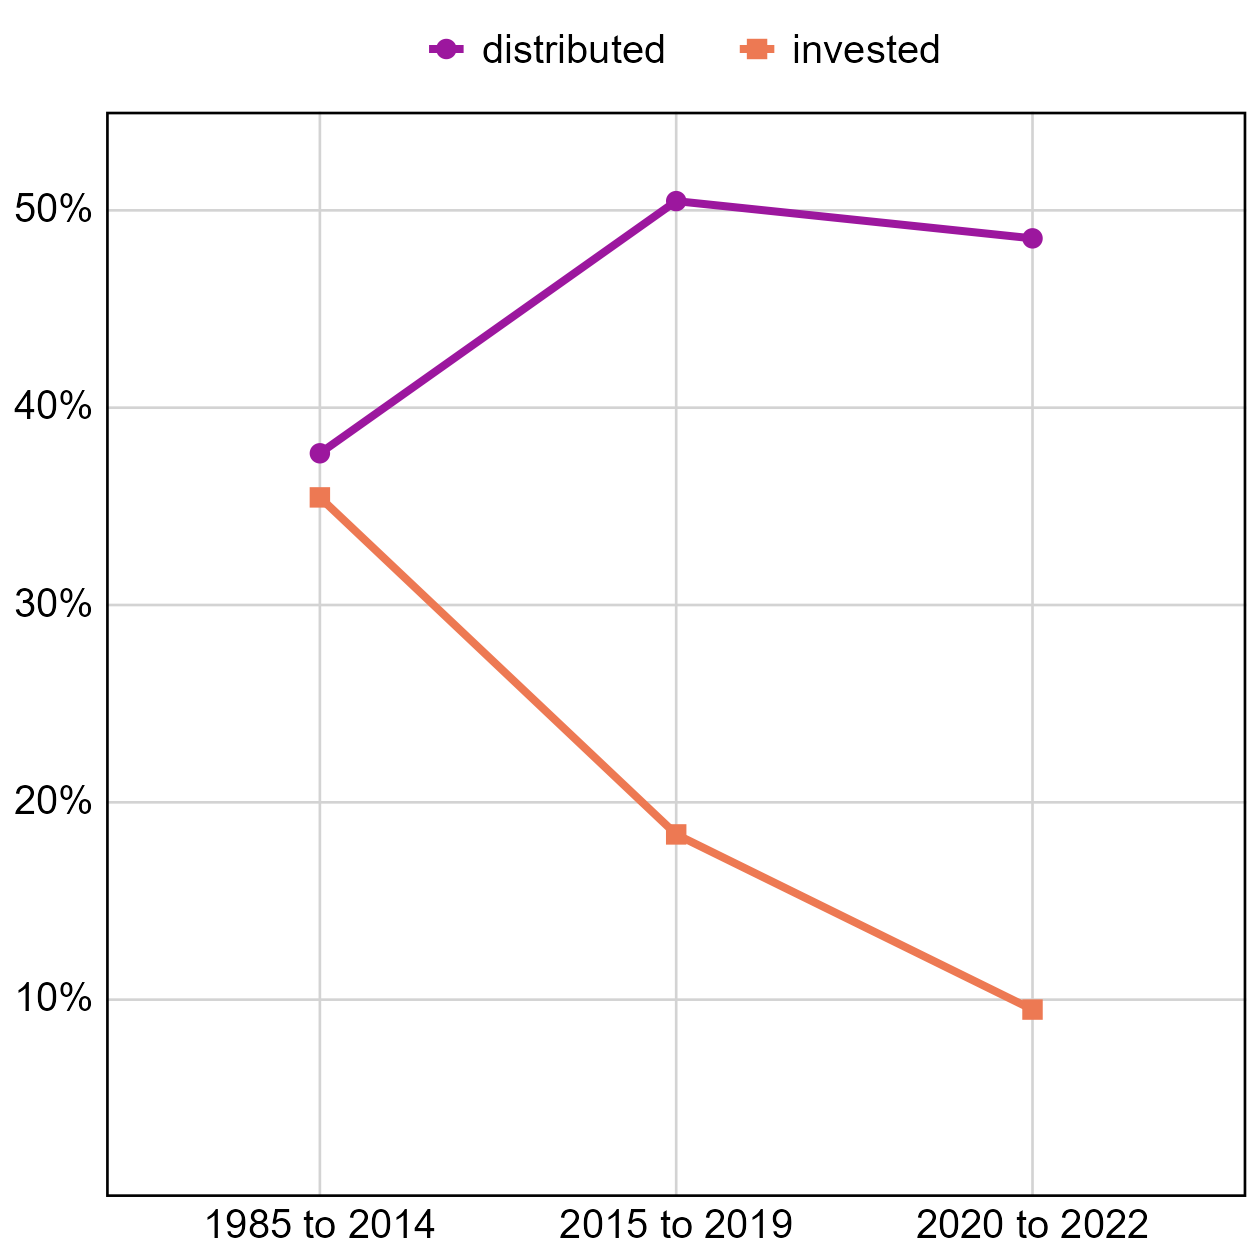
From 1985 to 2014, Canadian corporations distributed slightly more profit to owners than they invested—38% vs. 36% (figure 3). That changed dramatically in 2015. Over the next four years, more than 50% of profits were distributed, while less than 20% was invested. Since the pandemic, the share of profits invested has fallen to less than 10%, while shareholder distributions remained over 50%.
Figure 3: Investment and Distribution to Owners
Profits by Sector
Canada’s finance sector has grown significantly over the last 40 years (figure 4).[4] In the late-1980s, the finance sector claimed 17% of all operating profits by publicly-listed Canadian-headquartered corporations. Its share reached 34% in 2007. Although the Global Financial Crisis cut its share to 23% in 2008, it quickly recovered. Since 2015, 35% of operating profits have been collected by finance.
The oil & gas sector’s share of operating profits has also grown significantly. From 13% in the late-1980s, the sector claimed more than 25% operating profits from 2000 until 2014. The collapse of oil prices in 2015 dropped the sector’s share to just 8%. However, apart from the pandemic-induced disruption of 2020, it has steadily grown, collecting 26% of operating profits in 2022.
Figure 4: Operating Profits by Sector
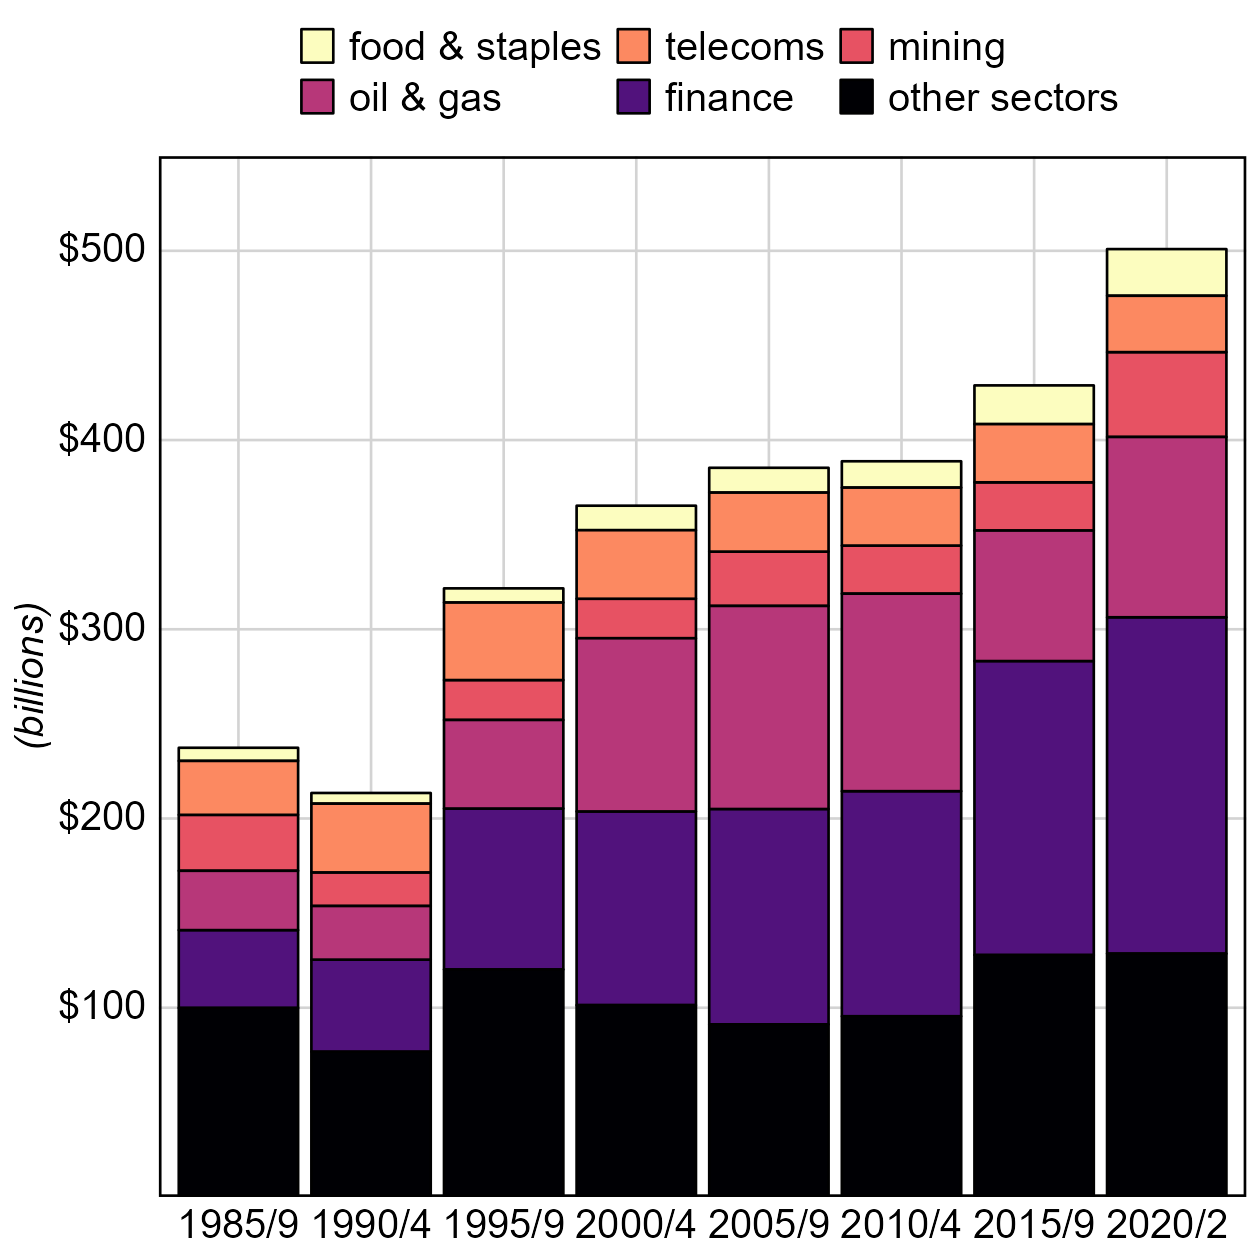
The finance and oil & gas sectors, combined, received more than half of all operating profits in 19 of the last 22 years.
Mining’s share reached an all-time high of 16% in 1988 but averaged about 7.5% until the collapse of commodity prices in the mid-2010s. It has returned to trend since the pandemic.
Telecoms have seen their share of profits steadily decline from 12% in the late-1980s to less than 6% since the pandemic. Conversely, the profit share for retailers of food & staples has steadily grown since the late-1990s.
Investment and Distribution by Sector
There are important operating and accounting differences between financial and non-financial corporations. The growth of the finance sector relative to the non-finance sectors could explain some of the dramatic increase in distribution and decrease in investments. However, as figure 5 shows, most major sectors distribute more of their profit than they invest.
Figure 5: Investment and Distribution to Owners by Sector
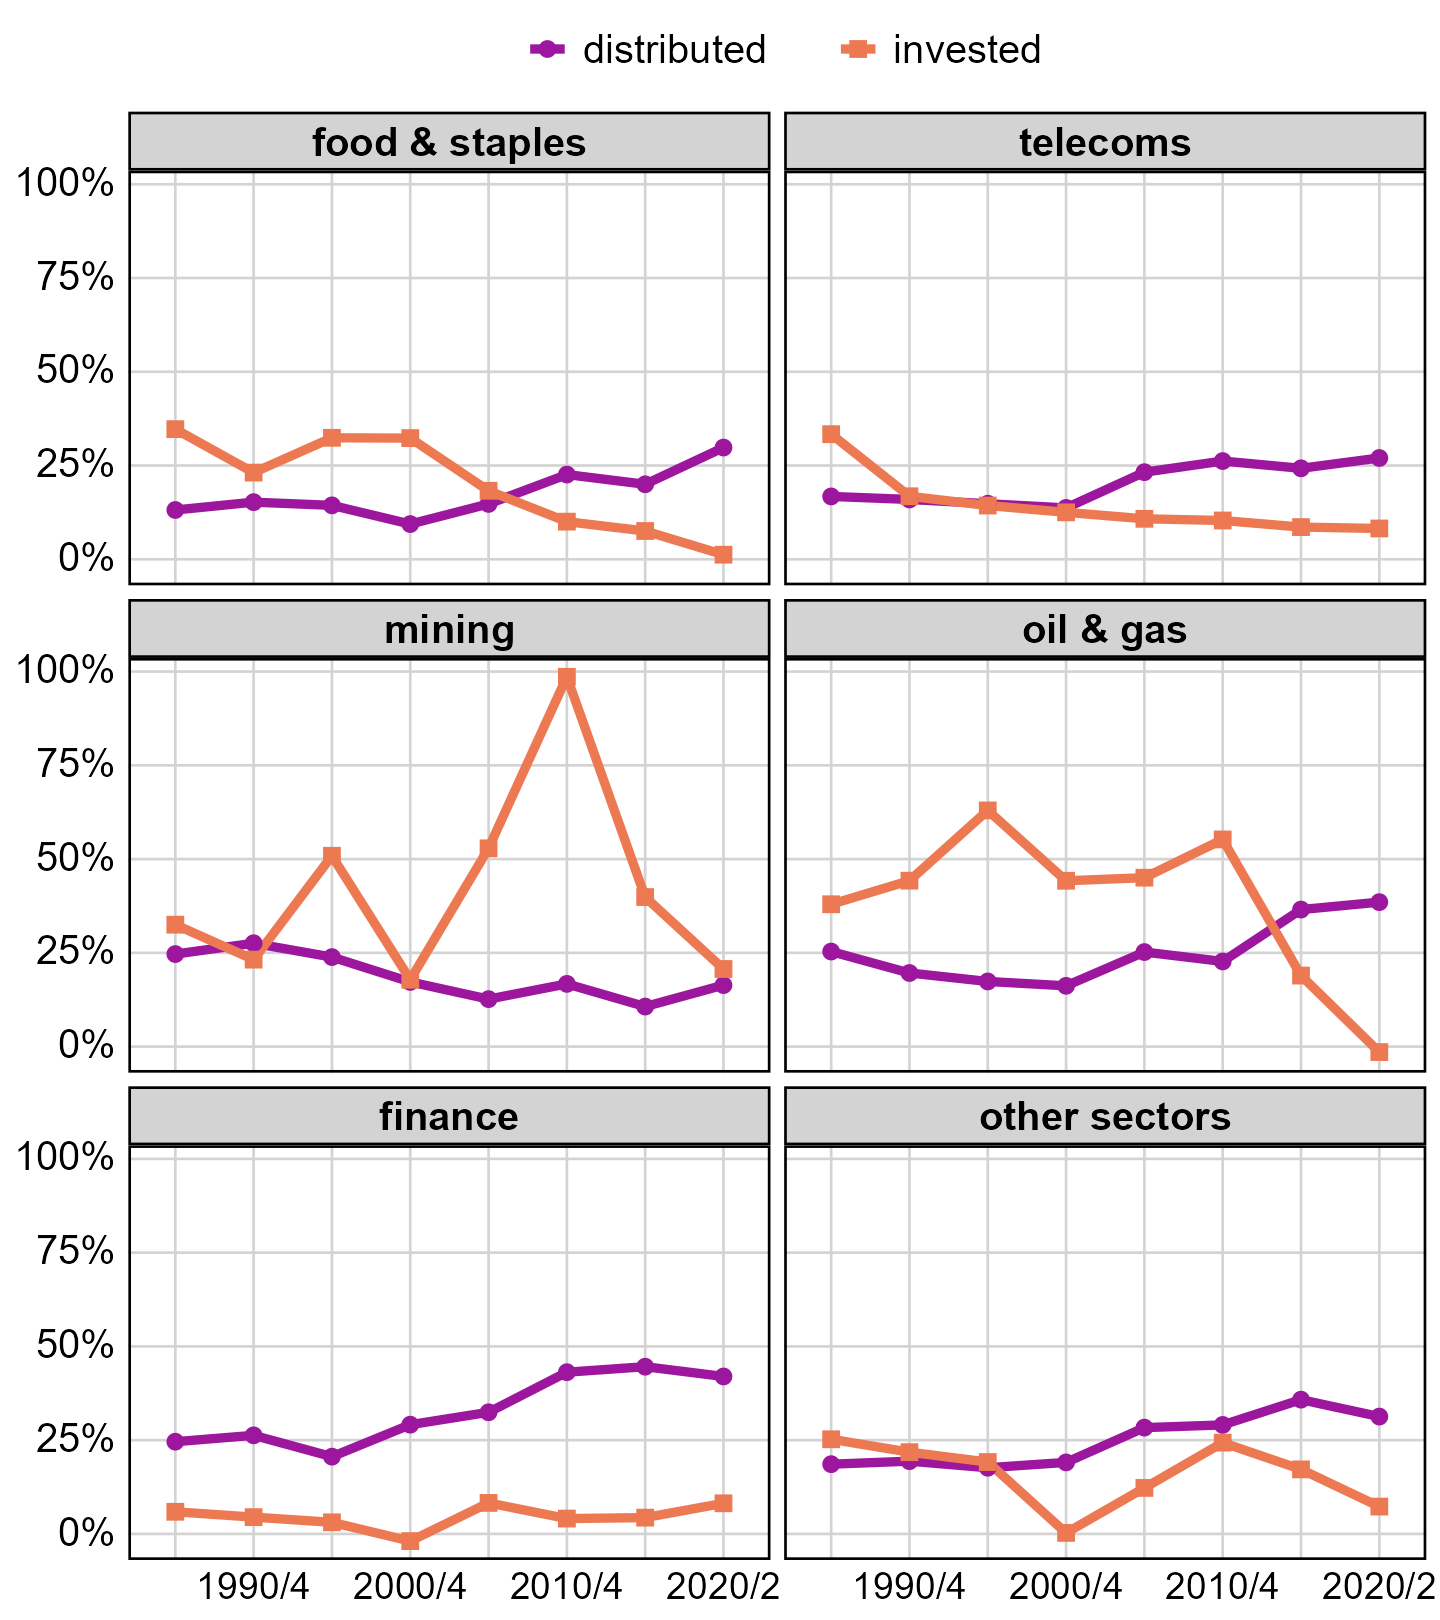
Of the sectors analyzed, only mining invests more than it distributes. Investment by food & staples retailers has trended downward since 2000 while distributions have trended upward. In 2020 to 2022, they distributed $21 billion (2022$) more than they invested. Telecoms have distributed about 25% of their profits since 2006 while their investment has fallen from a high of 33% in the late-1980s to less than 10% in almost every year since 2013.
The oil & gas sector invested much more than it distributed until 2015 when oil prices collapsed. Although oil prices and sector profits have rebounded, investment has not. In 2022, when the sector saw record profits, it distributed almost $52 billion more than it invested. Finance has consistently distributed more of its profits than it invested in productive capacity while the remaining sectors have done so since 1999.
Conclusion
Companies in all of Canada’s major non-finance sectors have been investing a smaller share of their profits in physical assets since at least 2015. This decline began in 2015 for the extractive industries, while it began much earlier for the other sectors. Further, in every sector, except for mining, more profit is distributed to owners than invested.
This pattern is not universal across all companies (see table below). However, it is widespread. A lack of investment in productive capacity is widely acknowledged as a major reason Canada’s productivity has stagnated. Despite decades of corporate tax cuts, which we were told would induce more investment, almost every sector invests less of their profit now than they did in the late-1980s when CIT rates were much higher.
Corporate ownership is very unequally distributed. This means distribution of a growing share of increasing profits worsens income and wealth inequality. Even if we accepted the idea that corporations are the best mechanisms for allocating capital, the data shows that instead of putting their profits into productive capacity, they are instead enriching their already rich owners.
The recent bout of pandemic-induced inflation showed that corporations have too much pricing power. Decades of policies justified as liberating the power of the market, including reduced CIT rates, have failed to produce the promised outcomes, such as more investment in productivity-enhancing assets. Rather, they seem to have made corporations more powerful social actors. Additional mechanisms beyond competitive forces need to be considered to prevent corporations from abusing that power, enriching themselves and their wealthy owners, at the expense of everyone else.
Profit is supposed to be a reward for innovation and increased efficiency. However, there is no evidence that the record profits corporations have collected since the pandemic were the result of either. Rather, they were the result of higher mark-ups in the context of rising costs. This allowed them to capture hundreds of billions of dollars from Canadian households, governments, and not-for-profits. This unearned income should be returned to public control through a windfall profit tax, so it can be invested where it is needed, such as much needed housing or improvements and expansion of the health care system. We should also end the experiment with low CIT rates.
Finally, this analysis was dependent on the financial disclosure of publicly-listed corporations. The public deserves more information about how corporations. U.S. corporations have to disclose their tax payments by jurisdiction—federal, state, foreign. Canadian corporations should be required to do the same. We should also have disclosure of country-by-country financials, so we can see were corporations are generating revenue, where they are claiming their profits, and where they are investing—or not investing.
Investment and Distribution by Select Non-financial Corporations
The table below reports the share of operating profits distributed and invested by 40 of Canada’s biggest, and most high-profile non-financial corporations in the years before and since the pandemic.[5]
| Company | Use of Profit | 2000-09 | 2010-19 | 2020-22 |
|---|---|---|---|---|
| Alimentation Couche-Tard Inc | distributed | 9% | 9% | 39% |
| invested | 24% | 9% | 4% | |
| AltaGas Ltd | distributed | 3% | 50% | 45% |
| invested | 50% | 78% | 38% | |
| Barrick Gold Corp | distributed | 14% | 9% | 18% |
| invested | 19% | 35% | 5% | |
| Bausch Health Cos Inc | distributed | 36% | 5% | 1% |
| invested | -2% | 0% | 3% | |
| BCE Inc. | distributed | 21% | 29% | 37% |
| invested | 12% | 9% | 11% | |
| Bombardier Inc | distributed | 18% | 13% | 10% |
| invested | 42% | 143% | 35% | |
| Canadian National Railway Co | distributed | 35% | 46% | 53% |
| invested | 15% | 23% | 16% | |
| Canadian Natural Resources Ltd | distributed | 3% | 16% | 38% |
| invested | 46% | 13% | -19% | |
| Canadian Pacific Kansas City Ltd | distributed | 14% | 41% | 28% |
| invested | 25% | 26% | 19% | |
| Canadian Solar Inc | distributed | 0% | 0% | 0% |
| invested | 313% | 97% | 49% | |
| Canadian Tire Corp Ltd | distributed | 7% | 30% | 21% |
| invested | 30% | 8% | -2% | |
| Canfor Corp | distributed | 5% | 9% | 2% |
| invested | -9% | 8% | 2% | |
| CGI Inc | distributed | 34% | 34% | 50% |
| invested | 2% | -1% | -7% | |
| Cogeco Communications Inc | distributed | 3% | 8% | 21% |
| invested | 18% | 5% | 7% | |
| Dollarama Inc | distributed | 0% | 72% | 49% |
| invested | 5% | 6% | -11% | |
| Emera Inc | distributed | 22% | 26% | 33% |
| invested | 12% | 38% | 75% | |
| Empire Co Ltd | distributed | 5% | 13% | 19% |
| invested | 32% | 13% | -12% | |
| Enbridge Inc | distributed | 26% | 45% | 64% |
| invested | 48% | 79% | 20% | |
| Fortis Inc | distributed | 17% | 24% | 26% |
| invested | 61% | 55% | 57% | |
| Imperial Oil Ltd | distributed | 41% | 21% | 65% |
| invested | 14% | 54% | -24% | |
| Leon’s Furniture Ltd | distributed | 16% | 2% | 31% |
| invested | 19% | -6% | -22% | |
| Loblaw Cos Ltd | distributed | 12% | 29% | 35% |
| invested | 33% | 8% | 1% | |
| Lululemon Athletica Inc | distributed | 0% | 27% | 30% |
| invested | 19% | 13% | 12% | |
| Magna International Inc | distributed | 18% | 41% | 33% |
| invested | 11% | 17% | 2% | |
| Maple Leaf Foods Inc | distributed | 9% | 36% | 32% |
| invested | 9% | 35% | 79% | |
| Martinrea International Inc | distributed | 0% | 5% | 5% |
| invested | 36% | 31% | 19% | |
| Metro Inc | distributed | 18% | 43% | 33% |
| invested | 10% | 8% | 5% | |
| Nutrien Ltd | distributed | 42% | 55% | 38% |
| invested | 28% | 26% | 1% | |
| Quebecor Inc | distributed | 1% | 6% | 25% |
| invested | -2% | 9% | -10% | |
| Rogers Communications Inc | distributed | 14% | 25% | 17% |
| invested | 17% | 8% | 2% | |
| Saputo Inc | distributed | 19% | 32% | 21% |
| invested | 2% | 6% | 4% | |
| Shaw Communications Inc. | distributed | 27% | 21% | 36% |
| invested | 29% | 12% | -5% | |
| SNC-Lavalin Group Inc | distributed | 19% | 32% | 5% |
| invested | 25% | 96% | -37% | |
| Suncor Energy Inc. | distributed | 8% | 26% | 34% |
| invested | 86% | 3% | -31% | |
| TC Energy Corp | distributed | 19% | 32% | 46% |
| invested | 13% | 61% | 51% | |
| Teck Resources Ltd | distributed | 12% | 13% | 15% |
| invested | 6% | 22% | 57% | |
| TELUS Corp | distributed | 19% | 28% | 28% |
| invested | 11% | 13% | 14% | |
| Thomson Reuters Corp | distributed | 34% | 88% | 78% |
| invested | 9% | 19% | 16% | |
| Waste Connections Inc. | distributed | 19% | 14% | 27% |
| invested | 9% | -2% | 4% | |
| West Fraser Timber Co Ltd | distributed | 7% | 24% | 39% |
| invested | -26% | 15% | 1% |
Method
This analysis uses data from the Compustat database for companies listed on North American exchanges. The database compiles data from the financial disclosures of publicly-listed companies. Reported values may be adjusted by Compustat to standardize database concepts across companies and over time.
Companies were selected using the following criteria:
- Canadian-headquartered (LOC == CAN)
- Reported values for market equity (PRCC_C * CSHO), operating revenue (SALE), and operating expenses (XOPR)
- At least five years of data
- Not in the real estate sector (GSECTOR != 60)
Real estate companies were excluded because the sector is dominated by REITs (real estate investment trusts), which have a different tax treatment related to their distribution to owners.
Note that by focusing on Canadian-headquartered companies, this analysis is not synonymous with corporate investment in Canada. Many non-Canadian companies operate and invest in Canada, while Canadian-headquartered companies operate and invest abroad.
[1] Based on operating profits in USD adjusted for inflation by taking the value relative to US GDP.
[2] Note that this was calculated using book taxes, which are not the same as taxes actually paid. Book taxes are notional and reported on corporate income statements. Taxes paid are actual and reported on the statement of cash flow. Ostensibly, the two should only differ because of the timing difference between a company’s fiscal reporting and its tax reporting. However, companies will also defer taxes for various reasons. Taxes paid was not consistently reported until 2000.
[3] Depreciation is a notional expense. When a company makes an investment, it does not record the expense all at once. Instead, the expense gets recorded as depreciation for tangible assets, or as amortization for intangible assets. The idea is that an investment is really a kind of asset swap. The company exchanges financial assets for a productive asset. Then, the cost is the yearly wear-and-tear and/or obsolescence of that productive asset. However, for this analysis, depreciation is being treated as an actual expense, so only capital expenditure less depreciation constitutes net investment in physical assets, as a portion of capital expenditure has to be used to repair and maintain the value of existing assets.
[4] Sectors were identified using GICS codes.
[5] This calculation uses operating profits before interest and income tax expenses to eliminate incidences of a negative value in the denominator. Negative invested values occur when capital expenditures are less than depreciation, which indicates companies are not maintaining their existing physical assets.