From David Ruccio Income inequality continues to grow in the United States—which represents the very definition of insanity: “doing the same thing over and over again and expecting different results.” According to recent data by Thomas Piketty, Emmanuel Saez, and Gabriel Zucman, from 1979 through 2006, the share of pre-tax income going to the bottom 50 percent of U.S. households fell from an already-low 20.1 percent to an even-lower 13.5 percent. During that same period, the top 1 percent went from 11.1 percent to 20.1 percent. (Their respective shares crossed in 1995, when each—the bottom 50 percent and the top 1 percent—took home about 15.5 percent of pre-tax income). In 1979, top 1-percent individuals earned on average 28 times more than bottom 50-percent individuals before tax while they earned 74 times more in 2006. Then, after the crash (when the share of the top 1 percent decreased, as expected), during the so-called recovery (starting in 2009), the share of the bottom 50 percent continued to fall (to 12.5 percent, in 2014, the last year for which data are available) while that of the top 1 percent was restored (to 20.2 percent, in 2014). By 2014, top 1-percent individuals earned on average 81 times more than bottom 50-percent individuals.
Topics:
David F. Ruccio considers the following as important: Uncategorized
This could be interesting, too:
tom writes The Ukraine war and Europe’s deepening march of folly
Stavros Mavroudeas writes CfP of Marxist Macroeconomic Modelling workgroup – 18th WAPE Forum, Istanbul August 6-8, 2025
Lars Pålsson Syll writes The pretence-of-knowledge syndrome
Dean Baker writes Crypto and Donald Trump’s strategic baseball card reserve
from David Ruccio
Income inequality continues to grow in the United States—which represents the very definition of insanity: “doing the same thing over and over again and expecting different results.”
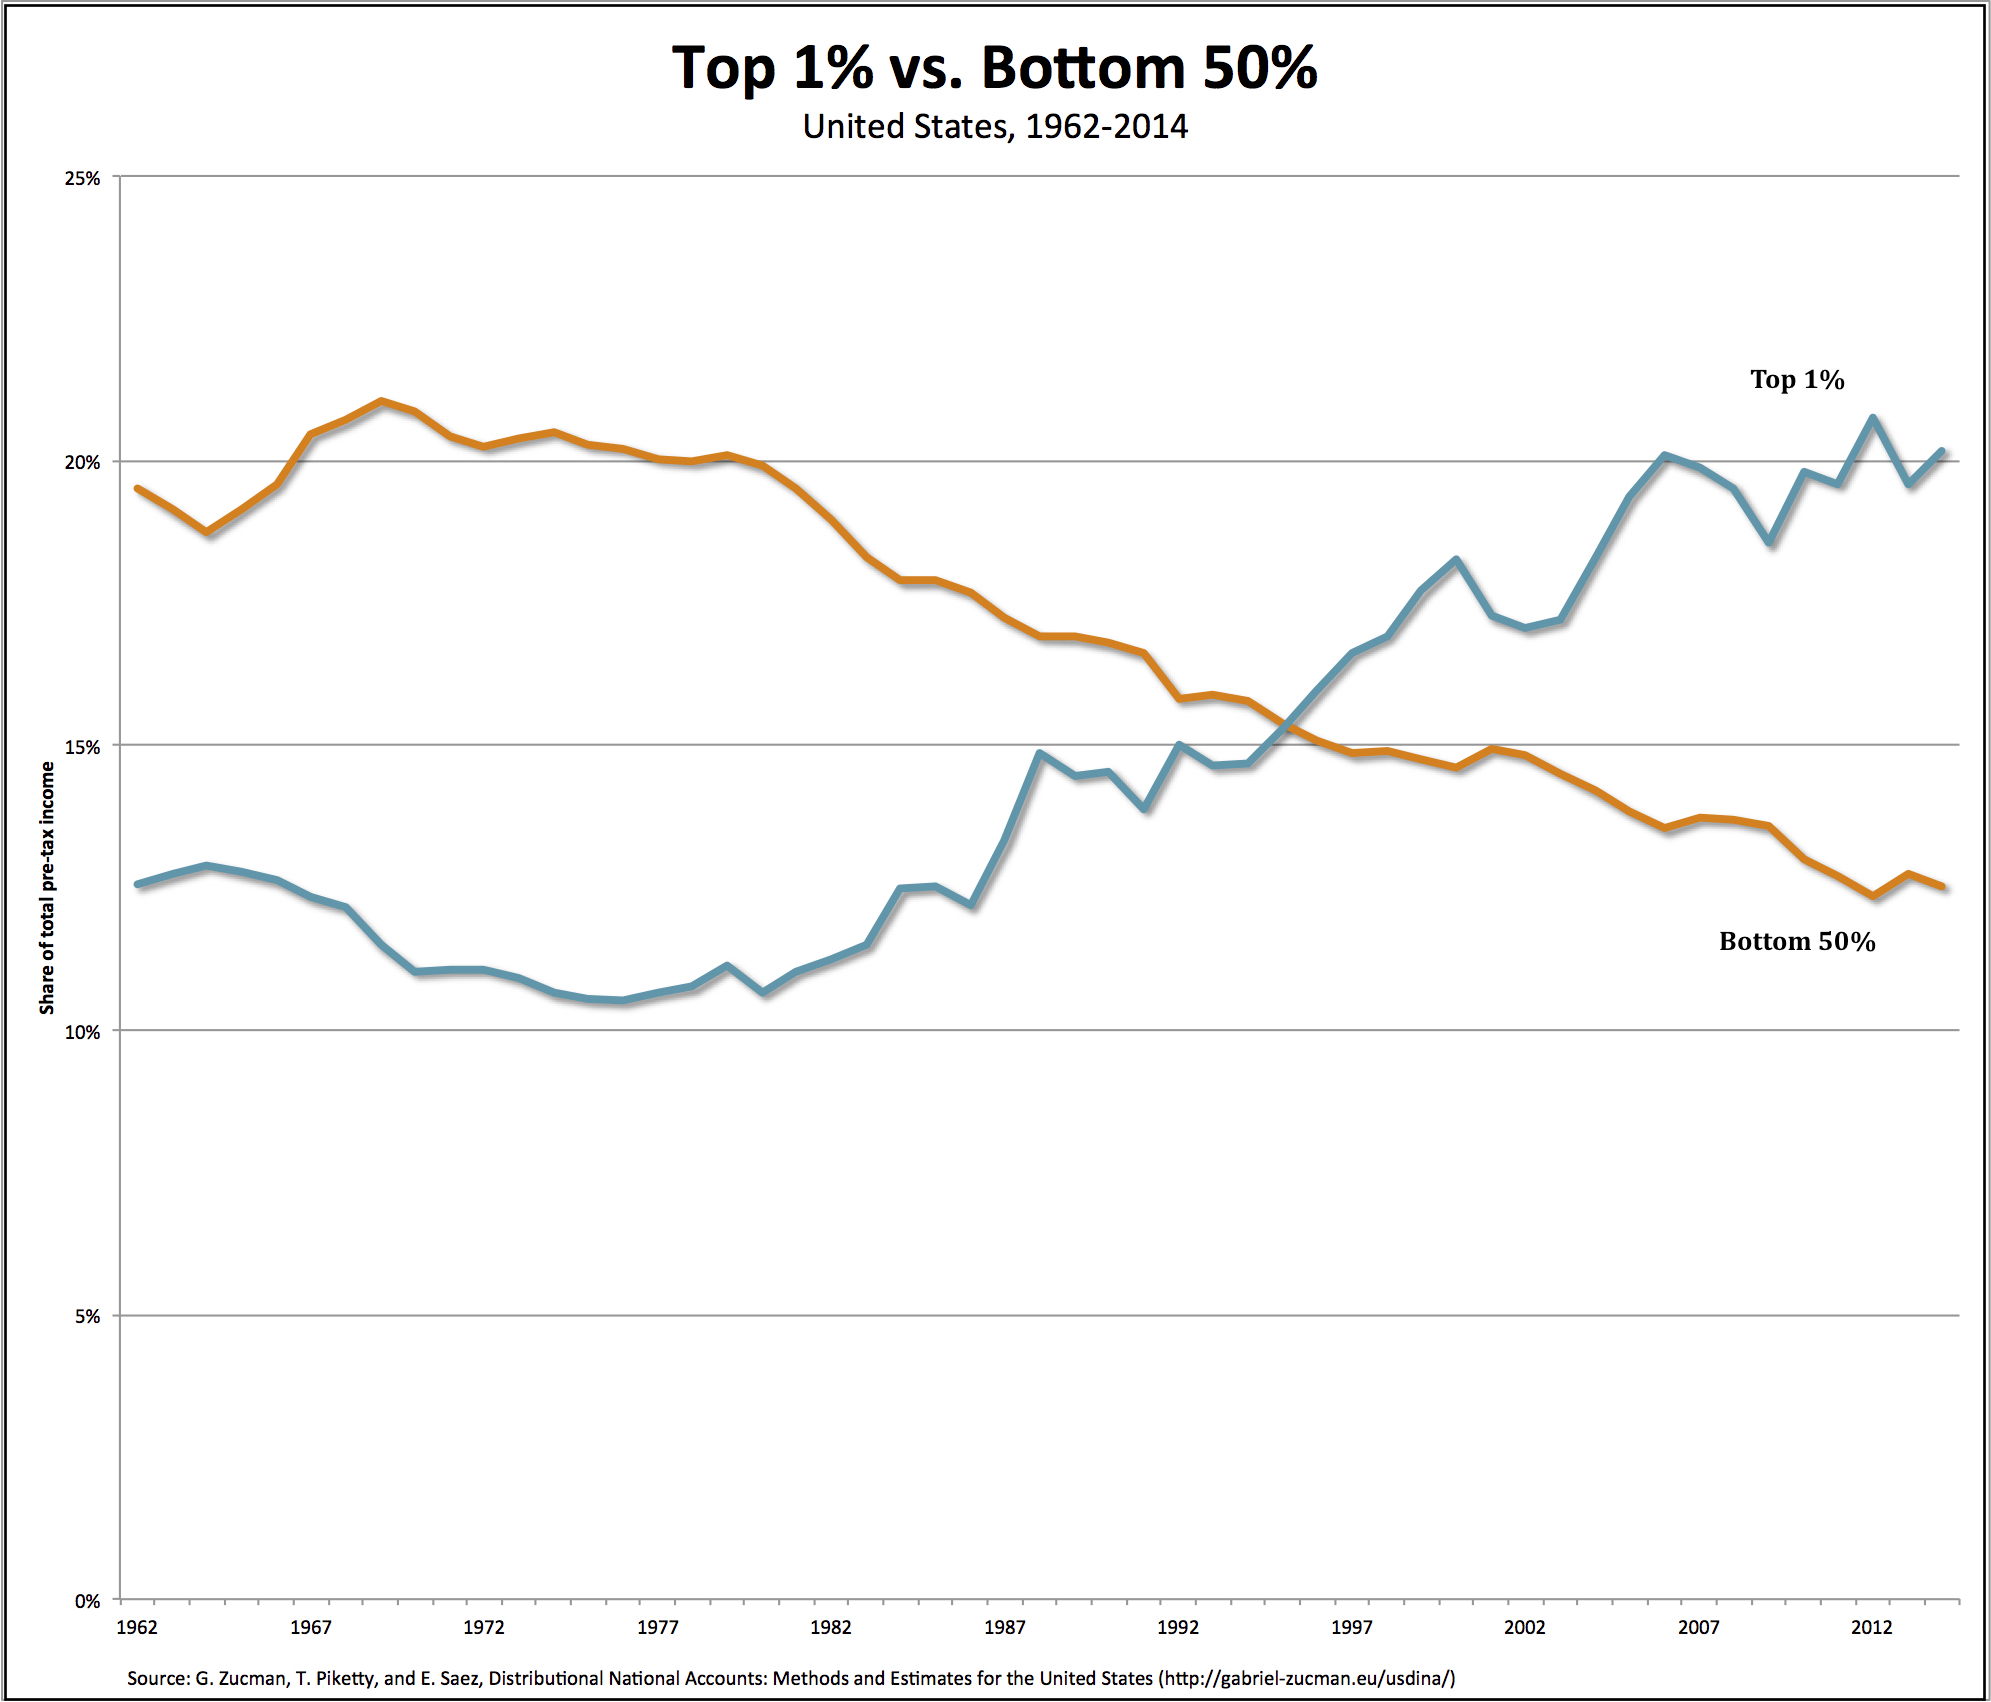
According to recent data by Thomas Piketty, Emmanuel Saez, and Gabriel Zucman, from 1979 through 2006, the share of pre-tax income going to the bottom 50 percent of U.S. households fell from an already-low 20.1 percent to an even-lower 13.5 percent. During that same period, the top 1 percent went from 11.1 percent to 20.1 percent. (Their respective shares crossed in 1995, when each—the bottom 50 percent and the top 1 percent—took home about 15.5 percent of pre-tax income). In 1979, top 1-percent individuals earned on average 28 times more than bottom 50-percent individuals before tax while they earned 74 times more in 2006.
Then, after the crash (when the share of the top 1 percent decreased, as expected), during the so-called recovery (starting in 2009), the share of the bottom 50 percent continued to fall (to 12.5 percent, in 2014, the last year for which data are available) while that of the top 1 percent was restored (to 20.2 percent, in 2014). By 2014, top 1-percent individuals earned on average 81 times more than bottom 50-percent individuals. The share of income going to the top 1 percent is now almost twice as large as that of the bottom 50-percent share, a group that is by definition fifty times more numerous.
And government redistribution has offset only a tiny fraction of the increase in pre-tax inequality. Even after taxes and transfers, the growth in average income for working-age adults in the bottom 50 percent of the distribution since 1979 has been much lower than that of working-age adults in the top 1 percent (34 percent vs. 141 percent).*
So, the growing inequality that has characterized the years of the recovery from the crash of 2007-08 mirrors the decades of rising inequality that caused the crash in the first place.
And that, in a word, is insane.
*In other words, while the aggregate flow of government transfers has increased, these transfers are largely targeted to the elderly and the middle-class (individuals above the median and below the 90th percentile). Transfers that go to the bottom 50 percent have not been large enough to lift income significantly, especially compared to those at the top. Thus, for example, in terms of shares of post-tax income from 1979 to 2014, the bottom 50 percent has fallen from 25.6 percent to 19.4 percent, while the share of the top 1 percent has risen, from 9.1 percent to 15.6 percent.