Aside: I didn’t know, but the ₹-sign is the official sign for the rupee Why did the Indian economy not succumb under the weight of the sudden demonetization of 8 November 2016? The answer: to an extent because the government and the commercial sector kept borrowing from banks and spent this money. There is overwhelming evidence that at the grassroots level the dearth of cash caused by the financial folly disproportionately hurt the poor and unbanked as rebuilding took time and converting old notes to new ones did led to a short but crippling decline in the amount of available cash. This despite the fact that a much larger proportion of outstanding ‘old’ cash was converted to new money than expected. In spite of this, the official economy grew. How come? Credit growth rapidly
Topics:
Merijn T. Knibbe considers the following as important: Uncategorized
This could be interesting, too:
tom writes The Ukraine war and Europe’s deepening march of folly
Stavros Mavroudeas writes CfP of Marxist Macroeconomic Modelling workgroup – 18th WAPE Forum, Istanbul August 6-8, 2025
Lars Pålsson Syll writes The pretence-of-knowledge syndrome
Dean Baker writes Crypto and Donald Trump’s strategic baseball card reserve
Aside: I didn’t know, but the ₹-sign is the official sign for the rupee
Why did the Indian economy not succumb under the weight of the sudden demonetization of 8 November 2016? The answer: to an extent because the government and the commercial sector kept borrowing from banks and spent this money.
There is overwhelming evidence that at the grassroots level the dearth of cash caused by the financial folly disproportionately hurt the poor and unbanked as rebuilding took time and converting old notes to new ones did led to a short but crippling decline in the amount of available cash. This despite the fact that a much larger proportion of outstanding ‘old’ cash was converted to new money than expected. In spite of this, the official economy grew. How come? Credit growth rapidly rebounded… (see below).The monetary and economic difference between the productive ‘GDP’ economy and the often quite unproductive ‘informal’ economy is consistent with recent economic history research which emphasizes that, historically, economies consist of different ‘spheres’ which use different kinds of means of payment.
Some days ago, I weighed in on a discussion about the ‘digitalizing’ of the monetary system in India. (look here, here, here), using data on the amount of ‘M1’ money in India (cash and overnight deposits). On 8 November 2016, 20:00 the Indian government unexpectedly declared ‘larger’ denominations of cash non legal tender which despite the fact that the money could be exchanged into new bills led to a sharp decline in the amount of M1 money. After about two months, a fast reflation of the amount of M1 money took place. There are two conundrums when it comes to this situation:
- Where did the money go in November and December 2016 and where did it come from after December 2016 (a flawless conversion of old to new money would not have led to the observed decline in the amount of M1 money).
- How is it possible that, contrary to expectations, GDP growth continued (though the informal sector did seem to have suffered to a considerable extent)
I will answer these questions with the help of data not just on M1 money (cash and overnight deposits) but also with data on M3 money (M1 money + medium term savings deposits) as well as with Indian Flow of Funds data (Money stock data are of course also part of the Flow of Funds); all data are from the Reserve Bank of India, freely available via the internet).
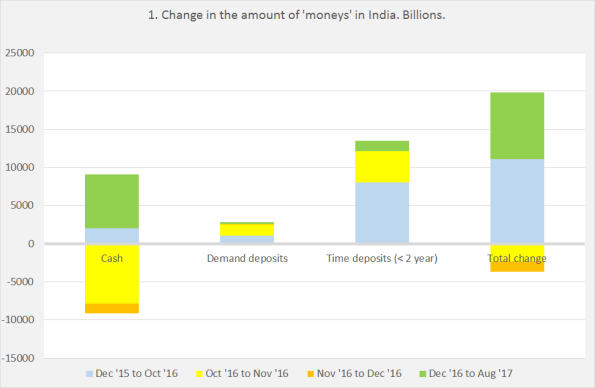
Graph 1 shows the constituent parts of M3 money (all data: Reserve Bank of India).The grey parts of the bars show ‘monetary business as usual’ or the situation in the months before 8 November. There was a steady growth of all kinds of money which is normal for a fast growing developing economy; the relatively large increase of time deposits (< 2 years) is remarkable. The yellow parts show developments in the two weeks between 8 November (when the policy was initiated) and the end of November! ‘Cash’ plummeted, overnight deposits increased. Remarkably, time deposits increase a lot. Presumably, a lot of defunct cash was converted not to overnight deposits but to time deposits – i.e. stacked away and not immediately available for exchange. In the four weeks between the end of November and the end of December changes were less explosive, but the amount of cash still declined, without a matching increase in overnight or time deposits.  As stated, after the end of December the amount of money and especially cash rapidly inflated again. The pattern above suggests that this might be understood as a rebuilding of cash hoards. The negative value in graph 2 of ‘net non-monetary liabilities of banks’ indicates that quite some money flowed to longer term time deposits which are not included in M-3 estimates of money and which show up as a negative in the Flow of Funds as changes in the amount of M-3 ‘deposit money’ are basically explained by changes in credit, which means that outflows to longer term deposits have to be matched by a negative on the credit side of the balance sheet. Read it as: ‘deposits not included in M-3’. In a technical sense that’s is not entirely correct but it will do the trick.
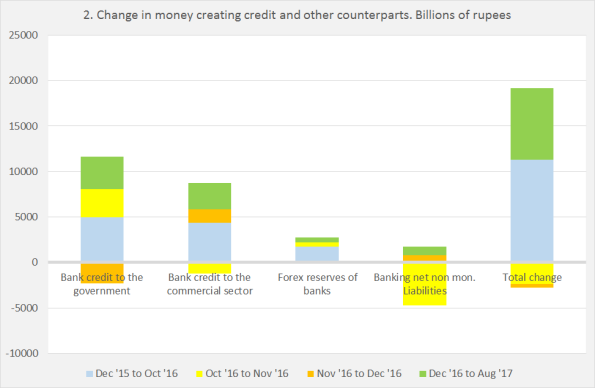
Graph 2 shows the development of credit. As should be well knows, ‘bank loans create deposits’ and summing bank loans gives you the total amount of deposits (though cash withdrawals have to be subtracted), a part of these are counted as ‘M-3’ or exchange money. The proverbial elephants in Jaipur (picture): except for some brief periods the government and the commercial sector, fortunately, kept borrowing which meant that quite soon the total amount of money started to increasing; quite some part of this money must, after spending by the government and companies, have been used to rebuild balance sheets of households and small companies, i.e. was withdrawn from deposits as cash. To enable such a development, this money had to be available in the first place! This remark is not inconsistent with the remark that, on the aggregate level, people also stacked money away on time deposits: on the disaggregated level it might well be about two or more groups of people wo use different kinds of money and who use the same money in a different way– we should not go for the representative consumer fallacy (grassroots comments about this are very welcome).
This seems to answer the first question: there were changes in the composition of balance sheets but as the government and the commercial sector kept borrowing it was possible, at least on the aggregate scale, to rapidly restore the composition of balance sheets. Except for a rather short period the amount of money kept increasing. As such this does not explain GDP growth but which does show that the money squeeze was not a constraint. A robust finding of economic historians is however that different kinds of money may be swapped – but that different kinds of transactions often do require a specific kind of money. You can’t use a pound to pay for a Bratwurst in Frankfurt; in my country companies are obliged to use deposit money to pay wages. Or think of the chips on a poker table. Or ‘reserves’ used for transactions between banks and the central bank – these won’t buy you a Bratwurst, too. And there was a severe decline of ‘cash on hand’. Which, as informal economies are largely cash based, did lead to a severe contraction of the informal economy. The best example of this was the (very welcome) demise of human trafficking after 8 November. Though, as far as I could gauge, this trade recovered with the reflating of the cash economy. The immediate hit to the informal economy was catastrophic. I do however get the vague impression that there has been a ‘V’ shaped recovery of which, sadly, the information on human trafficking is the best example I could find.