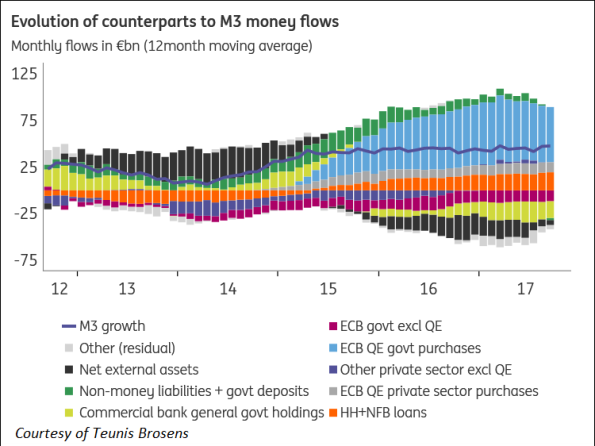
Did the growth of money caused by QE in the Eurozone (graph) stimulate economic activity? Not enough. According to John Maynard Keynes, in ‘The general theory’ (1936), “The relation of changes in M (money) to Y (income) and r (the interest rate) depends, in the first instance, on the way in which changes in M come about.” Put differently: credit and not money makes the world go round. Money creating lending to enable household purchases of existing homes has a quite different effect on the economy than money creating lending to exiting new companies which hire lots of labor to produce live saving medical equipment (or the latest craze, L.O.L. balls, works too). Quantitative easing by central banks is a nice albeit dismal empirical example which shows that the amount of money did grow
Topics:
Merijn T. Knibbe considers the following as important: Uncategorized
This could be interesting, too:
tom writes The Ukraine war and Europe’s deepening march of folly
Stavros Mavroudeas writes CfP of Marxist Macroeconomic Modelling workgroup – 18th WAPE Forum, Istanbul August 6-8, 2025
Lars Pålsson Syll writes The pretence-of-knowledge syndrome
Dean Baker writes Crypto and Donald Trump’s strategic baseball card reserve

Did the growth of money caused by QE in the Eurozone (graph) stimulate economic activity? Not enough. According to John Maynard Keynes, in ‘The general theory’ (1936),
“The relation of changes in M (money) to Y (income) and r (the interest rate) depends, in the first instance, on the way in which changes in M come about.”
Put differently: credit and not money makes the world go round. Money creating lending to enable household purchases of existing homes has a quite different effect on the economy than money creating lending to exiting new companies which hire lots of labor to produce live saving medical equipment (or the latest craze, L.O.L. balls, works too). Quantitative easing by central banks is a nice albeit dismal empirical example which shows that the amount of money did grow thanks to QE – but that the wrong sectors obtained the money. QE consists of a central bank buying bonds from for instance banks, pension funds and insurance companies. The graph shows that contributed quite a bit to money growth as we measure it. The money obtained by banks selling bonds (the light green bars) is not assumed to be part of ‘social money’ (i.e. money going around in the economy or M-3 money). The QE money paid to pension funds and insurance companies and the like (the light blue bars minus the light green bars) is however assumed to be part of M-3. But pension funds do not spend it in a useful way. They only buy other bonds and financial assets with the money. It would have been nice when pension funds, in a concerted effort with governments, had used QE money to invest in new houses, for instance in Amsterdam or London. But they generally don’t. Keynes was right – just looking at M is not enough. And QE was wrong – at least the kind of QE we’ve seen until today. QE as we know it can be defined as the unique way to expand the amount of money in a way that influences Y the least. Even buying bad debts from banks (and writing them down) would have been a better idea.
About the graph:
The thin blue line indicates the growth of M-3 money. The light blue bars stand for the amount of QE money going to pension funds and insurance companies and the like, to pay for existing bonds. The light green bars are bonds sold by banks (money flowing into banks is not considered to be part of M-3). The net contribution of the ‘MFI’ sector (monetary financial institutions, i.e. banks plus the ECB) to Eurozone moneygrowth is the light blue bars minus the light green bars and the purple bars. Interestingly, the net contribution of the ECB was, until the onset of QE, negative! ‘Net external assets’ can be understood as money flowing to Switzerland and comparable countries.
